Paraguayan vs Hungarian In Labor Force | Age 45-54
COMPARE
Paraguayan
Hungarian
In Labor Force | Age 45-54
In Labor Force | Age 45-54 Comparison
Paraguayans
Hungarians
83.5%
IN LABOR FORCE | AGE 45-54
98.5/ 100
METRIC RATING
57th/ 347
METRIC RANK
82.7%
IN LABOR FORCE | AGE 45-54
38.0/ 100
METRIC RATING
180th/ 347
METRIC RANK
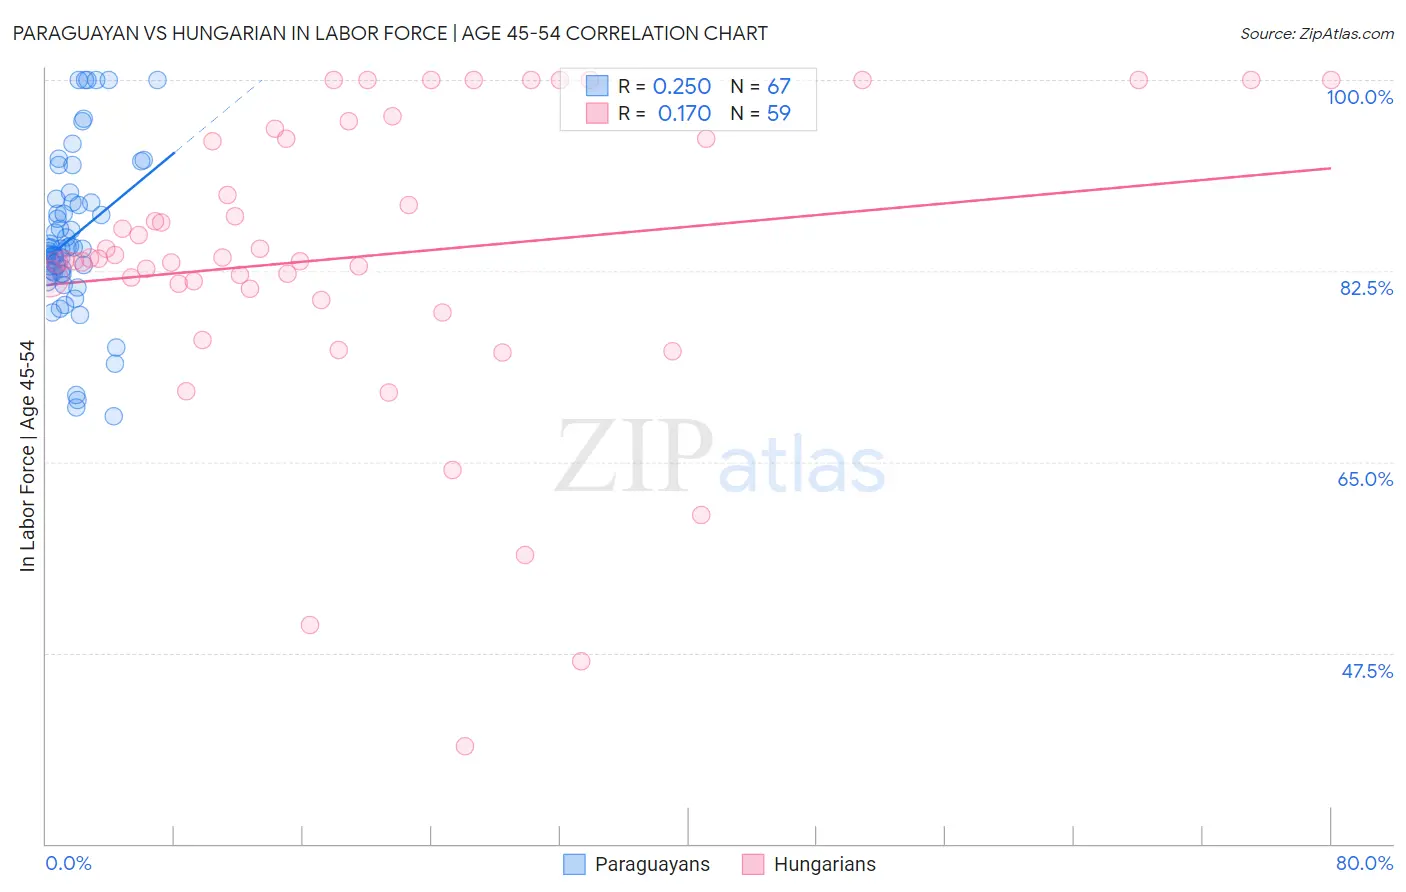
Paraguayan vs Hungarian In Labor Force | Age 45-54 Correlation Chart
The statistical analysis conducted on geographies consisting of 95,100,902 people shows a weak positive correlation between the proportion of Paraguayans and labor force participation rate among population between the ages 45 and 54 in the United States with a correlation coefficient (R) of 0.250 and weighted average of 83.5%. Similarly, the statistical analysis conducted on geographies consisting of 485,857,065 people shows a poor positive correlation between the proportion of Hungarians and labor force participation rate among population between the ages 45 and 54 in the United States with a correlation coefficient (R) of 0.170 and weighted average of 82.7%, a difference of 1.0%.
In Labor Force | Age 45-54 Correlation Summary
| Measurement | Paraguayan | Hungarian |
| Minimum | 69.2% | 38.9% |
| Maximum | 100.0% | 100.0% |
| Range | 30.8% | 61.1% |
| Mean | 85.6% | 83.8% |
| Median | 84.5% | 83.6% |
| Interquartile 25% (IQ1) | 82.2% | 80.9% |
| Interquartile 75% (IQ3) | 88.8% | 94.6% |
| Interquartile Range (IQR) | 6.6% | 13.7% |
| Standard Deviation (Sample) | 7.2% | 13.6% |
| Standard Deviation (Population) | 7.2% | 13.5% |
Similar Demographics by In Labor Force | Age 45-54
Demographics Similar to Paraguayans by In Labor Force | Age 45-54
In terms of in labor force | age 45-54, the demographic groups most similar to Paraguayans are Immigrants from Peru (83.5%, a difference of 0.010%), Eastern European (83.5%, a difference of 0.010%), Macedonian (83.5%, a difference of 0.020%), Somali (83.5%, a difference of 0.030%), and Bhutanese (83.5%, a difference of 0.030%).
| Demographics | Rating | Rank | In Labor Force | Age 45-54 |
| Immigrants | Greece | 98.8 /100 | #50 | Exceptional 83.6% |
| Immigrants | Turkey | 98.8 /100 | #51 | Exceptional 83.6% |
| Poles | 98.7 /100 | #52 | Exceptional 83.6% |
| Peruvians | 98.7 /100 | #53 | Exceptional 83.6% |
| Somalis | 98.7 /100 | #54 | Exceptional 83.5% |
| Macedonians | 98.7 /100 | #55 | Exceptional 83.5% |
| Immigrants | Peru | 98.6 /100 | #56 | Exceptional 83.5% |
| Paraguayans | 98.5 /100 | #57 | Exceptional 83.5% |
| Eastern Europeans | 98.5 /100 | #58 | Exceptional 83.5% |
| Bhutanese | 98.3 /100 | #59 | Exceptional 83.5% |
| Carpatho Rusyns | 98.3 /100 | #60 | Exceptional 83.5% |
| Filipinos | 98.3 /100 | #61 | Exceptional 83.5% |
| Immigrants | Taiwan | 98.0 /100 | #62 | Exceptional 83.5% |
| Afghans | 97.9 /100 | #63 | Exceptional 83.5% |
| Immigrants | Kenya | 97.9 /100 | #64 | Exceptional 83.5% |
Demographics Similar to Hungarians by In Labor Force | Age 45-54
In terms of in labor force | age 45-54, the demographic groups most similar to Hungarians are Israeli (82.7%, a difference of 0.0%), Immigrants from Switzerland (82.7%, a difference of 0.010%), Immigrants from Hungary (82.7%, a difference of 0.010%), Nigerian (82.7%, a difference of 0.020%), and New Zealander (82.6%, a difference of 0.050%).
| Demographics | Rating | Rank | In Labor Force | Age 45-54 |
| Nicaraguans | 50.3 /100 | #173 | Average 82.8% |
| Costa Ricans | 50.0 /100 | #174 | Average 82.8% |
| Immigrants | Liberia | 47.9 /100 | #175 | Average 82.7% |
| Northern Europeans | 46.9 /100 | #176 | Average 82.7% |
| Immigrants | Nicaragua | 44.6 /100 | #177 | Average 82.7% |
| Nigerians | 40.5 /100 | #178 | Average 82.7% |
| Immigrants | Switzerland | 39.4 /100 | #179 | Fair 82.7% |
| Hungarians | 38.0 /100 | #180 | Fair 82.7% |
| Israelis | 37.7 /100 | #181 | Fair 82.7% |
| Immigrants | Hungary | 37.1 /100 | #182 | Fair 82.7% |
| New Zealanders | 32.7 /100 | #183 | Fair 82.6% |
| Europeans | 32.6 /100 | #184 | Fair 82.6% |
| Immigrants | England | 32.2 /100 | #185 | Fair 82.6% |
| Irish | 29.2 /100 | #186 | Fair 82.6% |
| Immigrants | Costa Rica | 28.3 /100 | #187 | Fair 82.6% |