Immigrants from Egypt vs Immigrants from South Central Asia In Labor Force | Age 45-54

COMPARE

Immigrants from Egypt
Race
Ancestry
AfghanAfricanAlaska NativeAlaskan AthabascanAlbanianAleutAlsatianAmericanApacheArabArapahoArgentineanArmenianAssyrian/Chaldean/SyriacAustralianAustrianBahamianBangladeshiBarbadianBasqueBelgianBelizeanBermudanBhutaneseBlackfeetBolivianBrazilianBritishBritish West IndianBulgarianBurmeseCajunCambodianCanadianCape VerdeanCarpatho RusynCelticCentral AmericanCentral American IndianCherokeeCheyenneChickasawChileanChineseChippewaChoctawColombianColvilleComancheCosta RicanCreeCreekCroatianCrowCubanCypriotCzechCzechoslovakianDanishDelawareDominicanDutchDutch West IndianEastern EuropeanEcuadorianEgyptianEnglishEstonianEthiopianEuropeanFijianFilipinoFinnishFrenchFrench American IndianFrench CanadianGermanGerman RussianGhanaianGreekGuamanian/ChamorroGuatemalanGuyaneseHaitianHmongHonduranHopiHoumaHungarianIcelanderIndian (Asian)IndonesianInupiatIranianIraqiIrishIroquoisIsraeliItalianJamaicanJapaneseJordanianKenyanKiowaKoreanLaotianLatvianLebaneseLiberianLithuanianLumbeeLuxembourgerMacedonianMalaysianMalteseMarshalleseMenomineeMexicanMexican American IndianMongolianMoroccanNative HawaiianNavajoNepaleseNew ZealanderNicaraguanNigerianNorthern EuropeanNorwegianOkinawanOsageOttawaPaiutePakistaniPalestinianPanamanianParaguayanPennsylvania GermanPeruvianPimaPolishPortuguesePotawatomiPuebloPuerto RicanPuget Sound SalishRomanianRussianSalvadoranSamoanScandinavianScotch-IrishScottishSeminoleSenegaleseSerbianShoshoneSierra LeoneanSiouxSlavicSlovakSloveneSomaliSouth AfricanSouth AmericanSouth American IndianSoviet UnionSpaniardSpanishSpanish AmericanSpanish American IndianSri LankanSubsaharan AfricanSudaneseSwedishSwissSyrianTaiwaneseThaiTlingit-HaidaTohono O'OdhamTonganTrinidadian and TobagonianTsimshianTurkishU.S. Virgin IslanderUgandanUkrainianUruguayanUteVenezuelanVietnameseWelshWest IndianYakamaYaquiYugoslavianYumanYup'ikZimbabwean
Immigration
NonimmigrantsImmigrantsAfghanistanAfricaAlbaniaArgentinaArmeniaAsiaAustraliaAustriaBahamasBangladeshBarbadosBelarusBelgiumBelizeBoliviaBosnia and HerzegovinaBrazilBulgariaBurma/MyanmarCabo VerdeCambodiaCameroonCanadaCaribbeanCentral AmericaChileChinaColombiaCongoCosta RicaCroatiaCubaCzechoslovakiaDenmarkDominicaDominican RepublicEastern AfricaEastern AsiaEastern EuropeEcuadorEgyptEl SalvadorEnglandEritreaEthiopiaEuropeFijiFranceGermanyGhanaGreeceGrenadaGuatemalaGuyanaHaitiHondurasHong KongHungaryIndiaIndonesiaIranIraqIrelandIsraelItalyJamaicaJapanJordanKazakhstanKenyaKoreaKuwaitLaosLatin AmericaLatviaLebanonLiberiaLithuaniaMalaysiaMexicoMicronesiaMiddle AfricaMoldovaMoroccoNepalNetherlandsNicaraguaNigeriaNorth AmericaNorth MacedoniaNorthern AfricaNorthern EuropeNorwayOceaniaPakistanPanamaPeruPhilippinesPolandPortugalRomaniaRussiaSaudi ArabiaScotlandSenegalSerbiaSierra LeoneSingaporeSomaliaSouth AfricaSouth AmericaSouth Eastern AsiaSouthern EuropeSpainSri LankaSt. Vincent and the GrenadinesSudanSwedenSwitzerlandSyriaTaiwanThailandTrinidad and TobagoTurkeyUgandaUkraineUruguayUzbekistanVenezuelaVietnamWest IndiesWestern AfricaWestern AsiaWestern EuropeYemenZaireZimbabweAzores
Immigrants from South Central Asia
Race
Ancestry
AfghanAfricanAlaska NativeAlaskan AthabascanAlbanianAleutAlsatianAmericanApacheArabArapahoArgentineanArmenianAssyrian/Chaldean/SyriacAustralianAustrianBahamianBangladeshiBarbadianBasqueBelgianBelizeanBermudanBhutaneseBlackfeetBolivianBrazilianBritishBritish West IndianBulgarianBurmeseCajunCambodianCanadianCape VerdeanCarpatho RusynCelticCentral AmericanCentral American IndianCherokeeCheyenneChickasawChileanChineseChippewaChoctawColombianColvilleComancheCosta RicanCreeCreekCroatianCrowCubanCypriotCzechCzechoslovakianDanishDelawareDominicanDutchDutch West IndianEastern EuropeanEcuadorianEgyptianEnglishEstonianEthiopianEuropeanFijianFilipinoFinnishFrenchFrench American IndianFrench CanadianGermanGerman RussianGhanaianGreekGuamanian/ChamorroGuatemalanGuyaneseHaitianHmongHonduranHopiHoumaHungarianIcelanderIndian (Asian)IndonesianInupiatIranianIraqiIrishIroquoisIsraeliItalianJamaicanJapaneseJordanianKenyanKiowaKoreanLaotianLatvianLebaneseLiberianLithuanianLumbeeLuxembourgerMacedonianMalaysianMalteseMarshalleseMenomineeMexicanMexican American IndianMongolianMoroccanNative HawaiianNavajoNepaleseNew ZealanderNicaraguanNigerianNorthern EuropeanNorwegianOkinawanOsageOttawaPaiutePakistaniPalestinianPanamanianParaguayanPennsylvania GermanPeruvianPimaPolishPortuguesePotawatomiPuebloPuerto RicanPuget Sound SalishRomanianRussianSalvadoranSamoanScandinavianScotch-IrishScottishSeminoleSenegaleseSerbianShoshoneSierra LeoneanSiouxSlavicSlovakSloveneSomaliSouth AfricanSouth AmericanSouth American IndianSoviet UnionSpaniardSpanishSpanish AmericanSpanish American IndianSri LankanSubsaharan AfricanSudaneseSwedishSwissSyrianTaiwaneseThaiTlingit-HaidaTohono O'OdhamTonganTrinidadian and TobagonianTsimshianTurkishU.S. Virgin IslanderUgandanUkrainianUruguayanUteVenezuelanVietnameseWelshWest IndianYakamaYaquiYugoslavianYumanYup'ikZimbabwean
Immigration
NonimmigrantsImmigrantsAfghanistanAfricaAlbaniaArgentinaArmeniaAsiaAustraliaAustriaBahamasBangladeshBarbadosBelarusBelgiumBelizeBoliviaBosnia and HerzegovinaBrazilBulgariaBurma/MyanmarCabo VerdeCambodiaCameroonCanadaCaribbeanCentral AmericaChileChinaColombiaCongoCosta RicaCroatiaCubaCzechoslovakiaDenmarkDominicaDominican RepublicEastern AfricaEastern AsiaEastern EuropeEcuadorEl SalvadorEnglandEritreaEthiopiaEuropeFijiFranceGermanyGhanaGreeceGrenadaGuatemalaGuyanaHaitiHondurasHong KongHungaryIndiaIndonesiaIranIraqIrelandIsraelItalyJamaicaJapanJordanKazakhstanKenyaKoreaKuwaitLaosLatin AmericaLatviaLebanonLiberiaLithuaniaMalaysiaMexicoMicronesiaMiddle AfricaMoldovaMoroccoNepalNetherlandsNicaraguaNigeriaNorth AmericaNorth MacedoniaNorthern AfricaNorthern EuropeNorwayOceaniaPakistanPanamaPeruPhilippinesPolandPortugalRomaniaRussiaSaudi ArabiaScotlandSenegalSerbiaSierra LeoneSingaporeSomaliaSouth AfricaSouth AmericaSouth Central AsiaSouth Eastern AsiaSouthern EuropeSpainSri LankaSt. Vincent and the GrenadinesSudanSwedenSwitzerlandSyriaTaiwanThailandTrinidad and TobagoTurkeyUgandaUkraineUruguayUzbekistanVenezuelaVietnamWest IndiesWestern AfricaWestern AsiaWestern EuropeYemenZaireZimbabweAzores
In Labor Force | Age 45-54
Income
Poverty
Unemployment
Labor Participation
Family Structure
Vehicle Availability
Education Level
Disability

In Labor Force | Age 45-54 Comparison

Immigrants from Egypt

Immigrants from South Central Asia

Exceptional
Exceptional
83.4%
IN LABOR FORCE | AGE 45-54
96.6/ 100
METRIC RATING
78th/ 347
METRIC RANK
84.0%
IN LABOR FORCE | AGE 45-54
99.9/ 100
METRIC RATING
18th/ 347
METRIC RANK

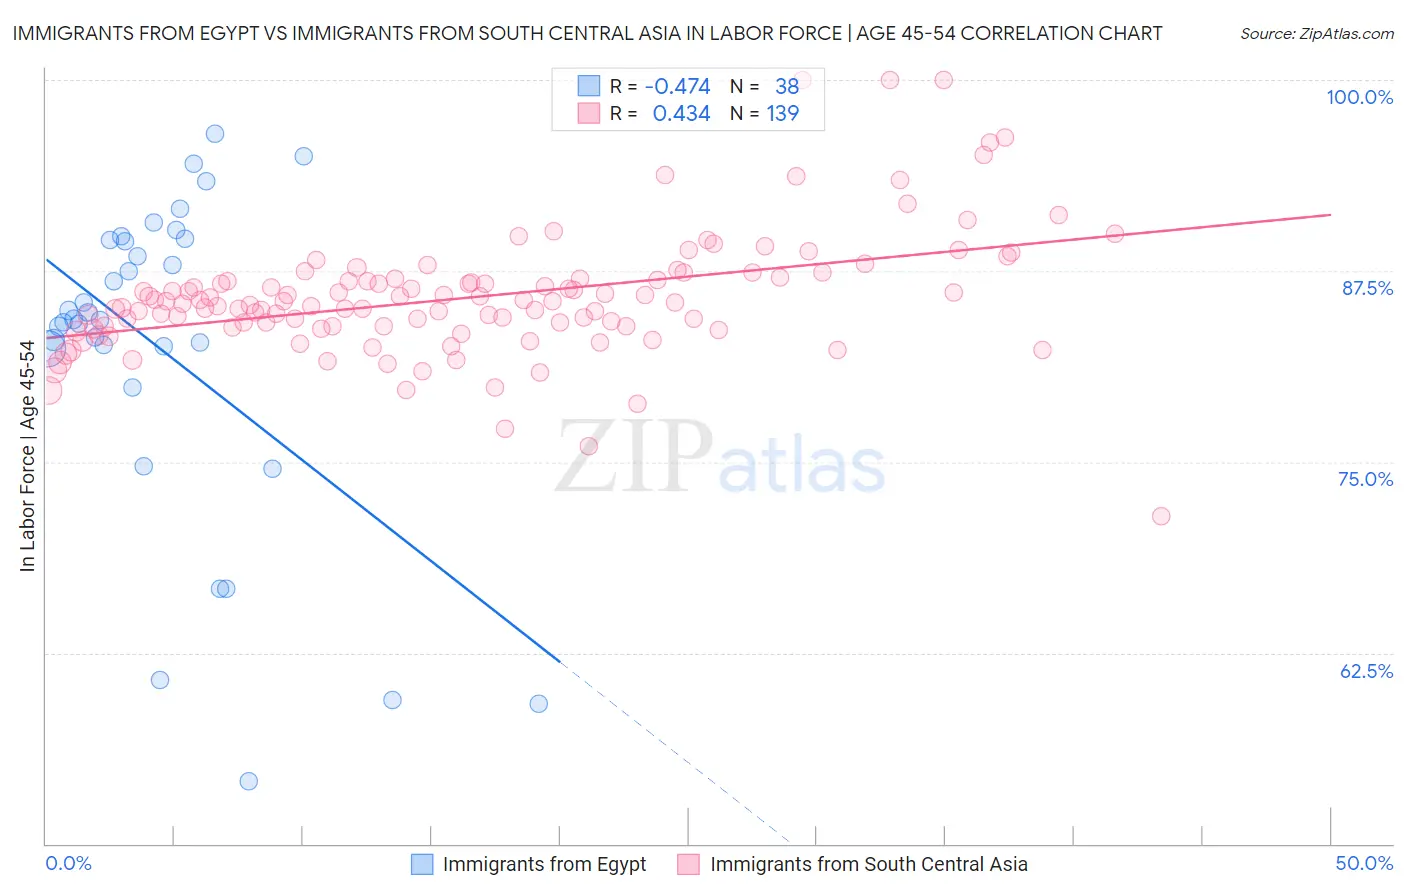
Immigrants from Egypt vs Immigrants from South Central Asia In Labor Force | Age 45-54 Correlation Chart

The statistical analysis conducted on geographies consisting of 245,402,368 people shows a moderate negative correlation between the proportion of Immigrants from Egypt and labor force participation rate among population between the ages 45 and 54 in the United States with a correlation coefficient (R) of -0.474 and weighted average of 83.4%. Similarly, the statistical analysis conducted on geographies consisting of 472,630,186 people shows a moderate positive correlation between the proportion of Immigrants from South Central Asia and labor force participation rate among population between the ages 45 and 54 in the United States with a correlation coefficient (R) of 0.434 and weighted average of 84.0%, a difference of 0.78%.
Immigrants from Egypt vs Immigrants from South Central Asia In Labor Force | Age 45-54

In Labor Force | Age 45-54 Correlation Summary

MeasurementImmigrants from EgyptImmigrants from South Central Asia
Minimum54.1%71.4%
Maximum96.5%100.0%
Range42.4%28.6%
Mean82.3%85.8%
Median84.3%85.5%
Interquartile 25% (IQ1)82.4%83.9%
Interquartile 75% (IQ3)89.5%87.0%
Interquartile Range (IQR)7.1%3.1%
Standard Deviation (Sample)10.6%4.1%
Standard Deviation (Population)10.5%4.0%

Similar Demographics by In Labor Force | Age 45-54

Demographics Similar to Immigrants from Egypt by In Labor Force | Age 45-54

In terms of in labor force | age 45-54, the demographic groups most similar to Immigrants from Egypt are Russian (83.4%, a difference of 0.010%), Cuban (83.4%, a difference of 0.010%), Belgian (83.4%, a difference of 0.010%), Immigrants from Croatia (83.4%, a difference of 0.010%), and Jordanian (83.4%, a difference of 0.010%).
DemographicsRating | RankIn Labor Force | Age 45-54
Colombians
97.3
/100
|
#71
Exceptional
83.4%
Serbians
97.2
/100
|
#72
Exceptional
83.4%
Immigrants | Czechoslovakia
97.1
/100
|
#73
Exceptional
83.4%
Immigrants | Somalia
96.9
/100
|
#74
Exceptional
83.4%
Estonians
96.9
/100
|
#75
Exceptional
83.4%
Russians
96.8
/100
|
#76
Exceptional
83.4%
Cubans
96.7
/100
|
#77
Exceptional
83.4%
Immigrants | Egypt
96.6
/100
|
#78
Exceptional
83.4%
Belgians
96.5
/100
|
#79
Exceptional
83.4%
Immigrants | Croatia
96.5
/100
|
#80
Exceptional
83.4%
Jordanians
96.4
/100
|
#81
Exceptional
83.4%
Immigrants | Eastern Asia
96.3
/100
|
#82
Exceptional
83.4%
Immigrants | Zimbabwe
96.3
/100
|
#83
Exceptional
83.4%
Immigrants | Bosnia and Herzegovina
96.0
/100
|
#84
Exceptional
83.3%
Greeks
95.9
/100
|
#85
Exceptional
83.3%

Demographics Similar to Immigrants from South Central Asia by In Labor Force | Age 45-54

In terms of in labor force | age 45-54, the demographic groups most similar to Immigrants from South Central Asia are Zimbabwean (84.0%, a difference of 0.0%), Immigrants from Nepal (84.0%, a difference of 0.030%), Cypriot (84.1%, a difference of 0.040%), Cambodian (84.1%, a difference of 0.10%), and Czech (83.9%, a difference of 0.11%).
DemographicsRating | RankIn Labor Force | Age 45-54
Thais
100.0
/100
|
#11
Exceptional
84.3%
Bulgarians
100.0
/100
|
#12
Exceptional
84.2%
Chinese
99.9
/100
|
#13
Exceptional
84.1%
Cambodians
99.9
/100
|
#14
Exceptional
84.1%
Cypriots
99.9
/100
|
#15
Exceptional
84.1%
Immigrants | Nepal
99.9
/100
|
#16
Exceptional
84.0%
Zimbabweans
99.9
/100
|
#17
Exceptional
84.0%
Immigrants | South Central Asia
99.9
/100
|
#18
Exceptional
84.0%
Czechs
99.8
/100
|
#19
Exceptional
83.9%
Immigrants | Eastern Africa
99.8
/100
|
#20
Exceptional
83.9%
Immigrants | Sri Lanka
99.8
/100
|
#21
Exceptional
83.9%
Immigrants | Ireland
99.8
/100
|
#22
Exceptional
83.9%
Tlingit-Haida
99.8
/100
|
#23
Exceptional
83.9%
Slovenes
99.8
/100
|
#24
Exceptional
83.9%
Immigrants | North Macedonia
99.8
/100
|
#25
Exceptional
83.9%