Immigrants from Egypt vs Hungarian Female Disability
COMPARE
Immigrants from Egypt
Hungarian
Female Disability
Female Disability Comparison
Immigrants from Egypt
Hungarians
11.1%
FEMALE DISABILITY
100.0/ 100
METRIC RATING
33rd/ 347
METRIC RANK
12.5%
FEMALE DISABILITY
7.2/ 100
METRIC RATING
229th/ 347
METRIC RANK
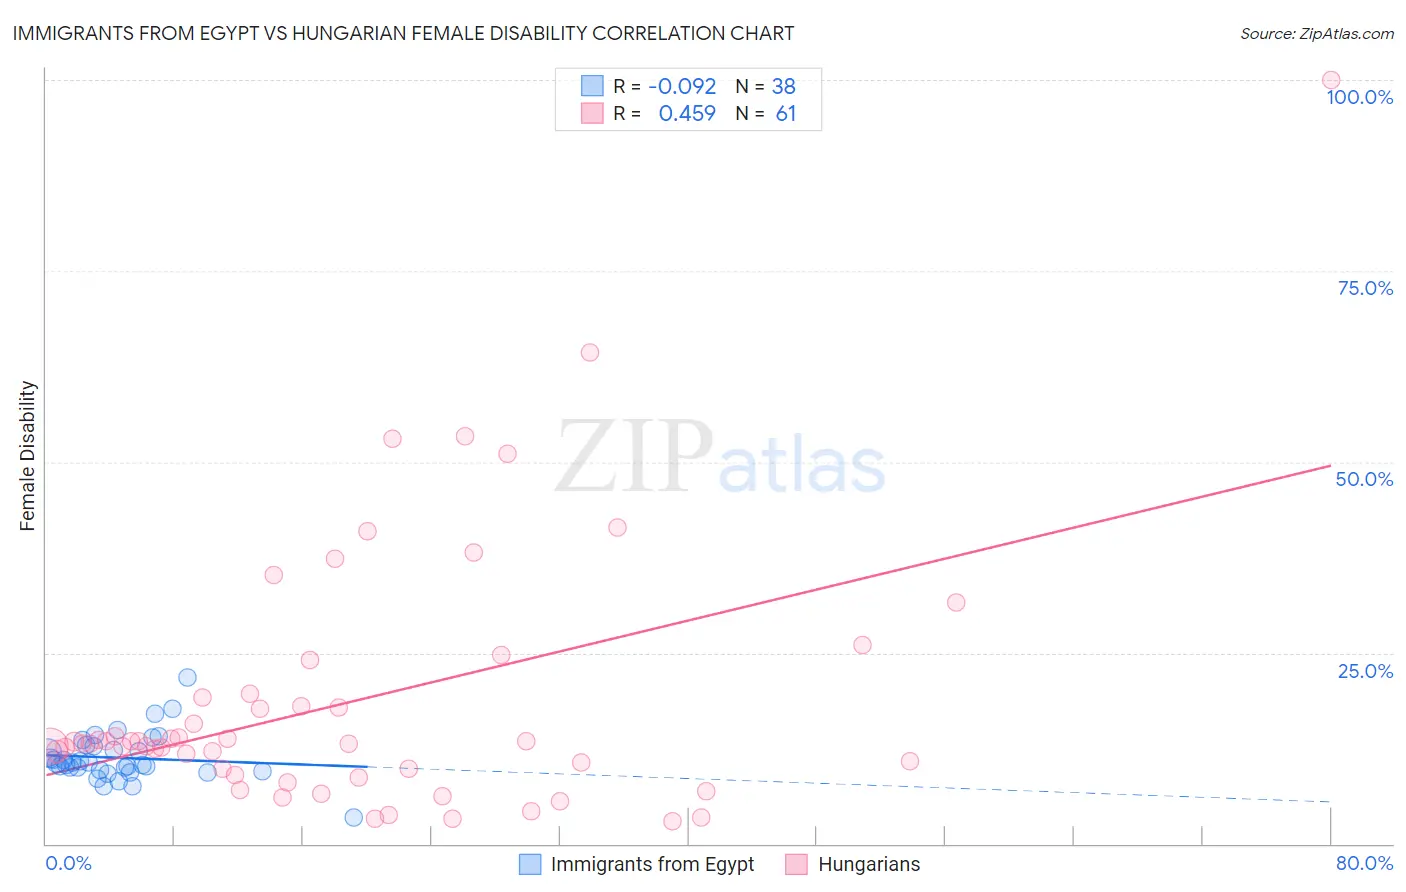
Immigrants from Egypt vs Hungarian Female Disability Correlation Chart
The statistical analysis conducted on geographies consisting of 245,491,192 people shows a slight negative correlation between the proportion of Immigrants from Egypt and percentage of females with a disability in the United States with a correlation coefficient (R) of -0.092 and weighted average of 11.1%. Similarly, the statistical analysis conducted on geographies consisting of 486,134,772 people shows a moderate positive correlation between the proportion of Hungarians and percentage of females with a disability in the United States with a correlation coefficient (R) of 0.459 and weighted average of 12.5%, a difference of 12.1%.
Female Disability Correlation Summary
| Measurement | Immigrants from Egypt | Hungarian |
| Minimum | 3.5% | 2.9% |
| Maximum | 21.8% | 100.0% |
| Range | 18.3% | 97.1% |
| Mean | 11.3% | 18.7% |
| Median | 10.6% | 13.1% |
| Interquartile 25% (IQ1) | 9.7% | 9.4% |
| Interquartile 75% (IQ3) | 12.8% | 19.4% |
| Interquartile Range (IQR) | 3.2% | 10.0% |
| Standard Deviation (Sample) | 3.2% | 17.3% |
| Standard Deviation (Population) | 3.1% | 17.2% |
Similar Demographics by Female Disability
Demographics Similar to Immigrants from Egypt by Female Disability
In terms of female disability, the demographic groups most similar to Immigrants from Egypt are Immigrants from Australia (11.1%, a difference of 0.080%), Immigrants from Kuwait (11.1%, a difference of 0.25%), Immigrants from Indonesia (11.2%, a difference of 0.25%), Immigrants from Malaysia (11.1%, a difference of 0.35%), and Turkish (11.1%, a difference of 0.35%).
| Demographics | Rating | Rank | Female Disability |
| Argentineans | 100.0 /100 | #26 | Exceptional 11.0% |
| Immigrants | Turkey | 100.0 /100 | #27 | Exceptional 11.1% |
| Egyptians | 100.0 /100 | #28 | Exceptional 11.1% |
| Immigrants | Malaysia | 100.0 /100 | #29 | Exceptional 11.1% |
| Turks | 100.0 /100 | #30 | Exceptional 11.1% |
| Immigrants | Kuwait | 100.0 /100 | #31 | Exceptional 11.1% |
| Immigrants | Australia | 100.0 /100 | #32 | Exceptional 11.1% |
| Immigrants | Egypt | 100.0 /100 | #33 | Exceptional 11.1% |
| Immigrants | Indonesia | 100.0 /100 | #34 | Exceptional 11.2% |
| Immigrants | Japan | 100.0 /100 | #35 | Exceptional 11.2% |
| Cypriots | 100.0 /100 | #36 | Exceptional 11.2% |
| Ethiopians | 100.0 /100 | #37 | Exceptional 11.2% |
| Immigrants | Ethiopia | 100.0 /100 | #38 | Exceptional 11.2% |
| Immigrants | Lithuania | 100.0 /100 | #39 | Exceptional 11.2% |
| Mongolians | 100.0 /100 | #40 | Exceptional 11.2% |
Demographics Similar to Hungarians by Female Disability
In terms of female disability, the demographic groups most similar to Hungarians are Immigrants from Belize (12.5%, a difference of 0.030%), Immigrants from Cambodia (12.5%, a difference of 0.070%), Assyrian/Chaldean/Syriac (12.5%, a difference of 0.10%), Hispanic or Latino (12.5%, a difference of 0.11%), and Belgian (12.5%, a difference of 0.11%).
| Demographics | Rating | Rank | Female Disability |
| Italians | 10.7 /100 | #222 | Poor 12.4% |
| Guamanians/Chamorros | 9.5 /100 | #223 | Tragic 12.5% |
| Belizeans | 9.3 /100 | #224 | Tragic 12.5% |
| Poles | 8.4 /100 | #225 | Tragic 12.5% |
| Hispanics or Latinos | 8.0 /100 | #226 | Tragic 12.5% |
| Assyrians/Chaldeans/Syriacs | 8.0 /100 | #227 | Tragic 12.5% |
| Immigrants | Cambodia | 7.8 /100 | #228 | Tragic 12.5% |
| Hungarians | 7.2 /100 | #229 | Tragic 12.5% |
| Immigrants | Belize | 7.0 /100 | #230 | Tragic 12.5% |
| Belgians | 6.5 /100 | #231 | Tragic 12.5% |
| Immigrants | Somalia | 5.9 /100 | #232 | Tragic 12.5% |
| Immigrants | Iraq | 5.3 /100 | #233 | Tragic 12.5% |
| Scandinavians | 5.3 /100 | #234 | Tragic 12.5% |
| Malaysians | 5.0 /100 | #235 | Tragic 12.5% |
| Immigrants | West Indies | 4.4 /100 | #236 | Tragic 12.6% |