Immigrants from Ecuador vs Immigrants from Kazakhstan In Labor Force | Age 25-29
COMPARE
Immigrants from Ecuador
Immigrants from Kazakhstan
In Labor Force | Age 25-29
In Labor Force | Age 25-29 Comparison
Immigrants from Ecuador
Immigrants from Kazakhstan
84.3%
IN LABOR FORCE | AGE 25-29
9.3/ 100
METRIC RATING
217th/ 347
METRIC RANK
84.4%
IN LABOR FORCE | AGE 25-29
17.5/ 100
METRIC RATING
200th/ 347
METRIC RANK
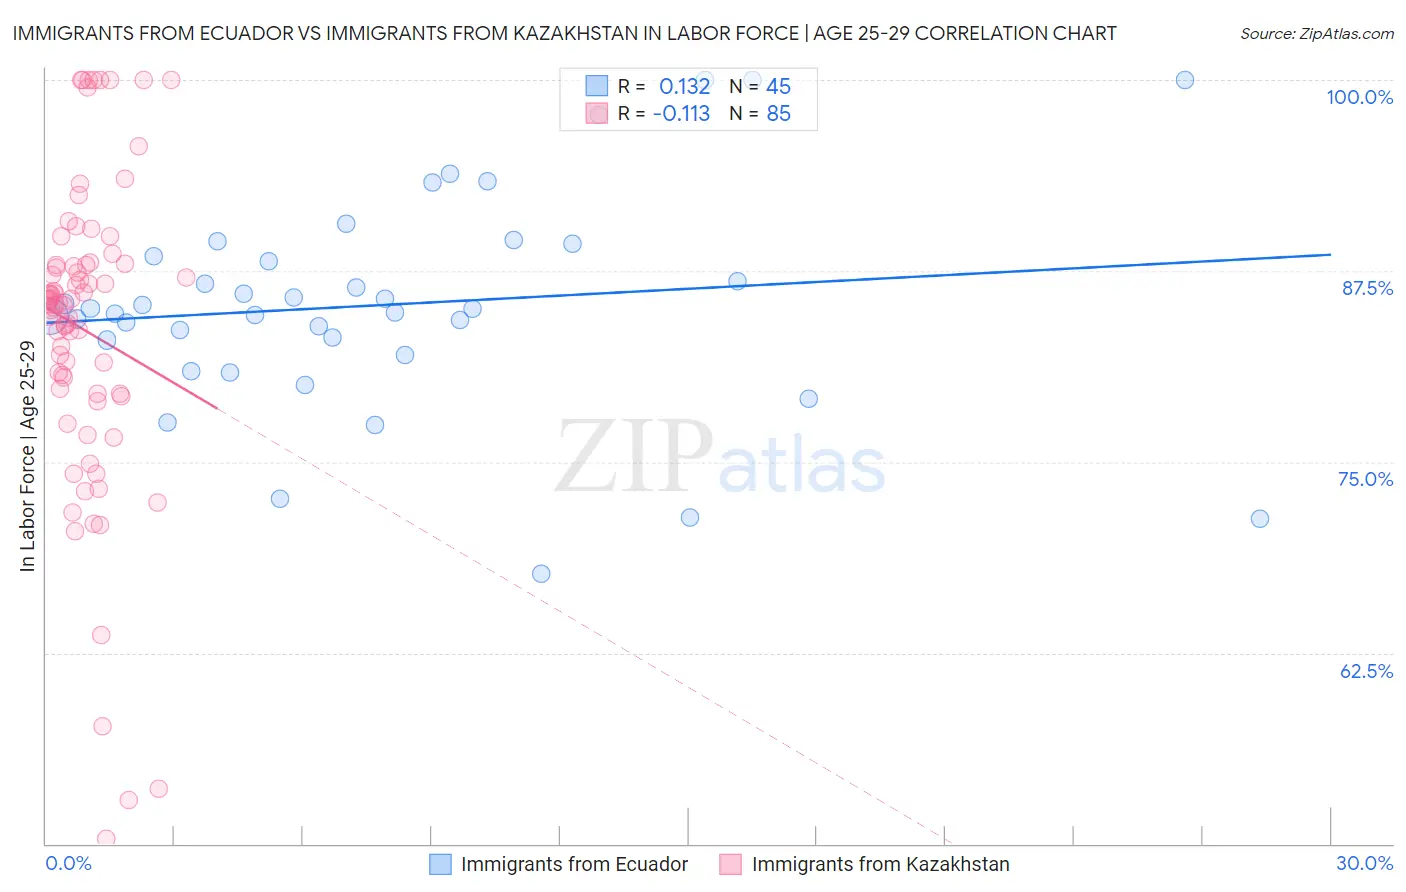
Immigrants from Ecuador vs Immigrants from Kazakhstan In Labor Force | Age 25-29 Correlation Chart
The statistical analysis conducted on geographies consisting of 270,970,556 people shows a poor positive correlation between the proportion of Immigrants from Ecuador and labor force participation rate among population between the ages 25 and 29 in the United States with a correlation coefficient (R) of 0.132 and weighted average of 84.3%. Similarly, the statistical analysis conducted on geographies consisting of 124,427,458 people shows a poor negative correlation between the proportion of Immigrants from Kazakhstan and labor force participation rate among population between the ages 25 and 29 in the United States with a correlation coefficient (R) of -0.113 and weighted average of 84.4%, a difference of 0.13%.
In Labor Force | Age 25-29 Correlation Summary
| Measurement | Immigrants from Ecuador | Immigrants from Kazakhstan |
| Minimum | 67.7% | 50.3% |
| Maximum | 100.0% | 100.0% |
| Range | 32.3% | 49.7% |
| Mean | 85.3% | 83.6% |
| Median | 85.0% | 85.5% |
| Interquartile 25% (IQ1) | 82.5% | 79.5% |
| Interquartile 75% (IQ3) | 88.9% | 88.0% |
| Interquartile Range (IQR) | 6.4% | 8.5% |
| Standard Deviation (Sample) | 7.1% | 10.3% |
| Standard Deviation (Population) | 7.0% | 10.2% |
Demographics Similar to Immigrants from Ecuador and Immigrants from Kazakhstan by In Labor Force | Age 25-29
In terms of in labor force | age 25-29, the demographic groups most similar to Immigrants from Ecuador are Israeli (84.3%, a difference of 0.0%), Immigrants from Nigeria (84.3%, a difference of 0.010%), Immigrants from Syria (84.3%, a difference of 0.030%), Japanese (84.3%, a difference of 0.040%), and Lebanese (84.3%, a difference of 0.040%). Similarly, the demographic groups most similar to Immigrants from Kazakhstan are Immigrants from Germany (84.4%, a difference of 0.010%), Laotian (84.4%, a difference of 0.010%), Immigrants from Iraq (84.4%, a difference of 0.020%), Afghan (84.4%, a difference of 0.020%), and Immigrants from Afghanistan (84.4%, a difference of 0.020%).
| Demographics | Rating | Rank | In Labor Force | Age 25-29 |
| Immigrants | Iraq | 19.0 /100 | #198 | Poor 84.4% |
| Immigrants | Germany | 18.3 /100 | #199 | Poor 84.4% |
| Immigrants | Kazakhstan | 17.5 /100 | #200 | Poor 84.4% |
| Laotians | 16.6 /100 | #201 | Poor 84.4% |
| Afghans | 15.9 /100 | #202 | Poor 84.4% |
| Immigrants | Afghanistan | 15.6 /100 | #203 | Poor 84.4% |
| Venezuelans | 15.1 /100 | #204 | Poor 84.4% |
| Ecuadorians | 14.8 /100 | #205 | Poor 84.4% |
| Immigrants | Cambodia | 14.3 /100 | #206 | Poor 84.4% |
| Immigrants | Armenia | 13.3 /100 | #207 | Poor 84.4% |
| Immigrants | Indonesia | 13.2 /100 | #208 | Poor 84.4% |
| Immigrants | Jordan | 12.8 /100 | #209 | Poor 84.4% |
| Chinese | 12.7 /100 | #210 | Poor 84.3% |
| Immigrants | Venezuela | 12.6 /100 | #211 | Poor 84.3% |
| Sub-Saharan Africans | 11.7 /100 | #212 | Poor 84.3% |
| Japanese | 11.4 /100 | #213 | Poor 84.3% |
| Lebanese | 11.1 /100 | #214 | Poor 84.3% |
| Immigrants | Syria | 10.7 /100 | #215 | Poor 84.3% |
| Israelis | 9.3 /100 | #216 | Tragic 84.3% |
| Immigrants | Ecuador | 9.3 /100 | #217 | Tragic 84.3% |
| Immigrants | Nigeria | 9.0 /100 | #218 | Tragic 84.3% |