Immigrants from Ghana vs Immigrants from Indonesia In Labor Force | Age 20-24
COMPARE
Immigrants from Ghana
Immigrants from Indonesia
In Labor Force | Age 20-24
In Labor Force | Age 20-24 Comparison
Immigrants from Ghana
Immigrants from Indonesia
74.5%
IN LABOR FORCE | AGE 20-24
12.7/ 100
METRIC RATING
215th/ 347
METRIC RANK
73.4%
IN LABOR FORCE | AGE 20-24
0.3/ 100
METRIC RATING
271st/ 347
METRIC RANK
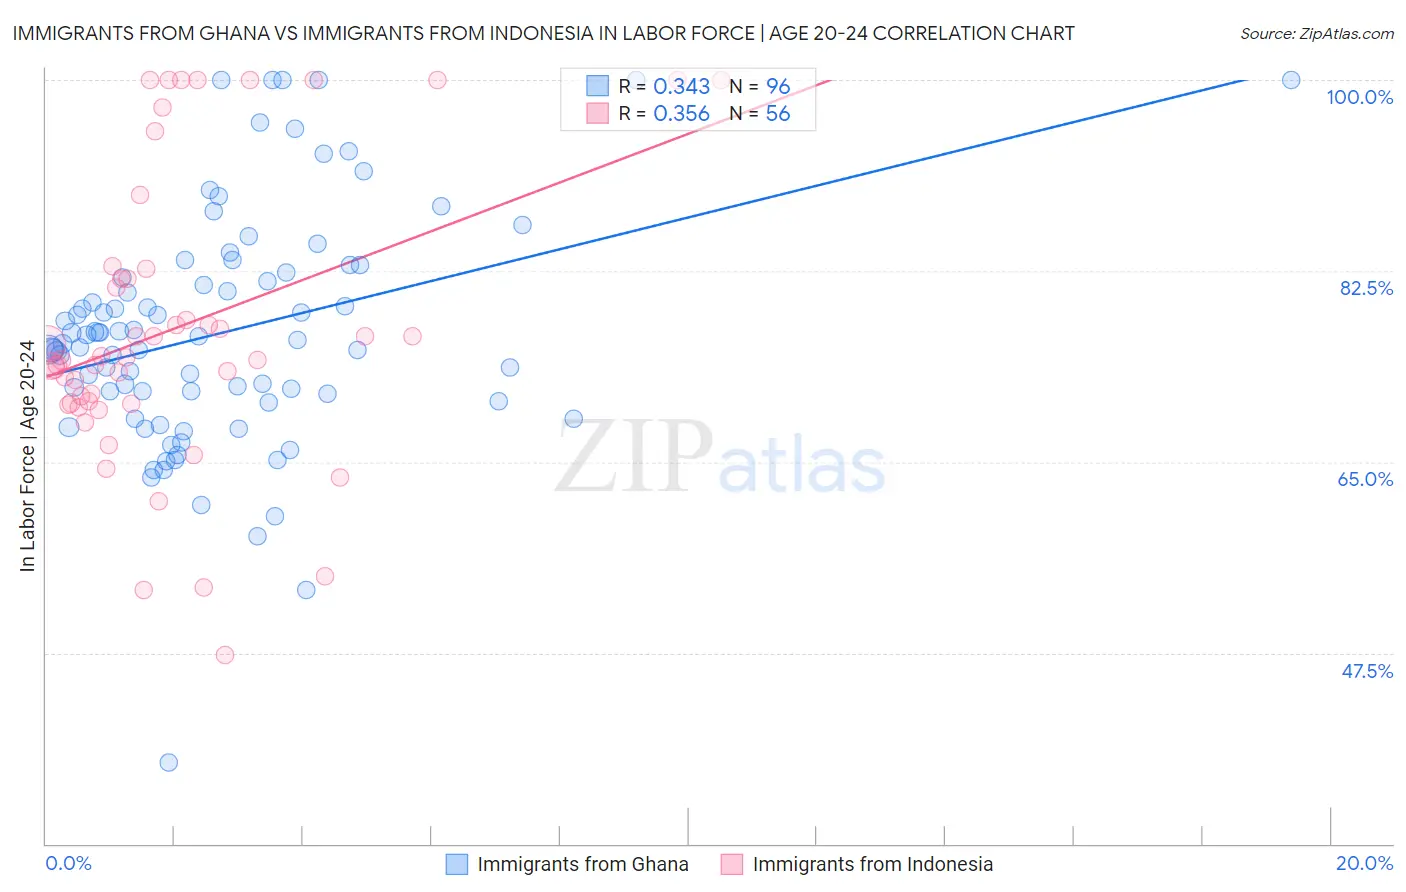
Immigrants from Ghana vs Immigrants from Indonesia In Labor Force | Age 20-24 Correlation Chart
The statistical analysis conducted on geographies consisting of 199,952,049 people shows a mild positive correlation between the proportion of Immigrants from Ghana and labor force participation rate among population between the ages 20 and 24 in the United States with a correlation coefficient (R) of 0.343 and weighted average of 74.5%. Similarly, the statistical analysis conducted on geographies consisting of 215,731,978 people shows a mild positive correlation between the proportion of Immigrants from Indonesia and labor force participation rate among population between the ages 20 and 24 in the United States with a correlation coefficient (R) of 0.356 and weighted average of 73.4%, a difference of 1.5%.
In Labor Force | Age 20-24 Correlation Summary
| Measurement | Immigrants from Ghana | Immigrants from Indonesia |
| Minimum | 37.5% | 47.3% |
| Maximum | 100.0% | 100.0% |
| Range | 62.5% | 52.7% |
| Mean | 76.8% | 77.4% |
| Median | 76.0% | 74.4% |
| Interquartile 25% (IQ1) | 70.9% | 70.4% |
| Interquartile 75% (IQ3) | 82.1% | 82.3% |
| Interquartile Range (IQR) | 11.2% | 11.9% |
| Standard Deviation (Sample) | 10.8% | 13.3% |
| Standard Deviation (Population) | 10.8% | 13.1% |
Similar Demographics by In Labor Force | Age 20-24
Demographics Similar to Immigrants from Ghana by In Labor Force | Age 20-24
In terms of in labor force | age 20-24, the demographic groups most similar to Immigrants from Ghana are Immigrants from Kuwait (74.5%, a difference of 0.0%), Chilean (74.5%, a difference of 0.010%), Creek (74.5%, a difference of 0.020%), Peruvian (74.5%, a difference of 0.020%), and Immigrants from Southern Europe (74.5%, a difference of 0.020%).
| Demographics | Rating | Rank | In Labor Force | Age 20-24 |
| Immigrants | Uruguay | 15.8 /100 | #208 | Poor 74.6% |
| Arabs | 15.8 /100 | #209 | Poor 74.6% |
| Uruguayans | 15.1 /100 | #210 | Poor 74.6% |
| Immigrants | Australia | 14.7 /100 | #211 | Poor 74.6% |
| Creek | 13.3 /100 | #212 | Poor 74.5% |
| Peruvians | 13.3 /100 | #213 | Poor 74.5% |
| Immigrants | Southern Europe | 13.2 /100 | #214 | Poor 74.5% |
| Immigrants | Ghana | 12.7 /100 | #215 | Poor 74.5% |
| Immigrants | Kuwait | 12.7 /100 | #216 | Poor 74.5% |
| Chileans | 12.5 /100 | #217 | Poor 74.5% |
| Immigrants | Peru | 10.6 /100 | #218 | Poor 74.5% |
| Nepalese | 10.5 /100 | #219 | Poor 74.5% |
| Immigrants | Norway | 10.3 /100 | #220 | Poor 74.5% |
| Chickasaw | 10.3 /100 | #221 | Poor 74.5% |
| Immigrants | India | 9.9 /100 | #222 | Tragic 74.4% |
Demographics Similar to Immigrants from Indonesia by In Labor Force | Age 20-24
In terms of in labor force | age 20-24, the demographic groups most similar to Immigrants from Indonesia are Belizean (73.4%, a difference of 0.010%), Cheyenne (73.4%, a difference of 0.040%), Immigrants from Russia (73.5%, a difference of 0.050%), Immigrants from Colombia (73.4%, a difference of 0.060%), and Colombian (73.5%, a difference of 0.090%).
| Demographics | Rating | Rank | In Labor Force | Age 20-24 |
| Immigrants | Haiti | 0.5 /100 | #264 | Tragic 73.6% |
| Burmese | 0.5 /100 | #265 | Tragic 73.6% |
| Haitians | 0.5 /100 | #266 | Tragic 73.6% |
| Immigrants | Western Asia | 0.4 /100 | #267 | Tragic 73.5% |
| South Americans | 0.4 /100 | #268 | Tragic 73.5% |
| Colombians | 0.3 /100 | #269 | Tragic 73.5% |
| Immigrants | Russia | 0.3 /100 | #270 | Tragic 73.5% |
| Immigrants | Indonesia | 0.3 /100 | #271 | Tragic 73.4% |
| Belizeans | 0.3 /100 | #272 | Tragic 73.4% |
| Cheyenne | 0.2 /100 | #273 | Tragic 73.4% |
| Immigrants | Colombia | 0.2 /100 | #274 | Tragic 73.4% |
| Immigrants | South America | 0.2 /100 | #275 | Tragic 73.3% |
| Mongolians | 0.2 /100 | #276 | Tragic 73.3% |
| Immigrants | Malaysia | 0.2 /100 | #277 | Tragic 73.3% |
| Cypriots | 0.2 /100 | #278 | Tragic 73.3% |