Immigrants from Eastern Europe vs Immigrants from Micronesia In Labor Force | Age 30-34
COMPARE
Immigrants from Eastern Europe
Immigrants from Micronesia
In Labor Force | Age 30-34
In Labor Force | Age 30-34 Comparison
Immigrants from Eastern Europe
Immigrants from Micronesia
85.4%
IN LABOR FORCE | AGE 30-34
99.3/ 100
METRIC RATING
68th/ 347
METRIC RANK
82.4%
IN LABOR FORCE | AGE 30-34
0.0/ 100
METRIC RATING
303rd/ 347
METRIC RANK
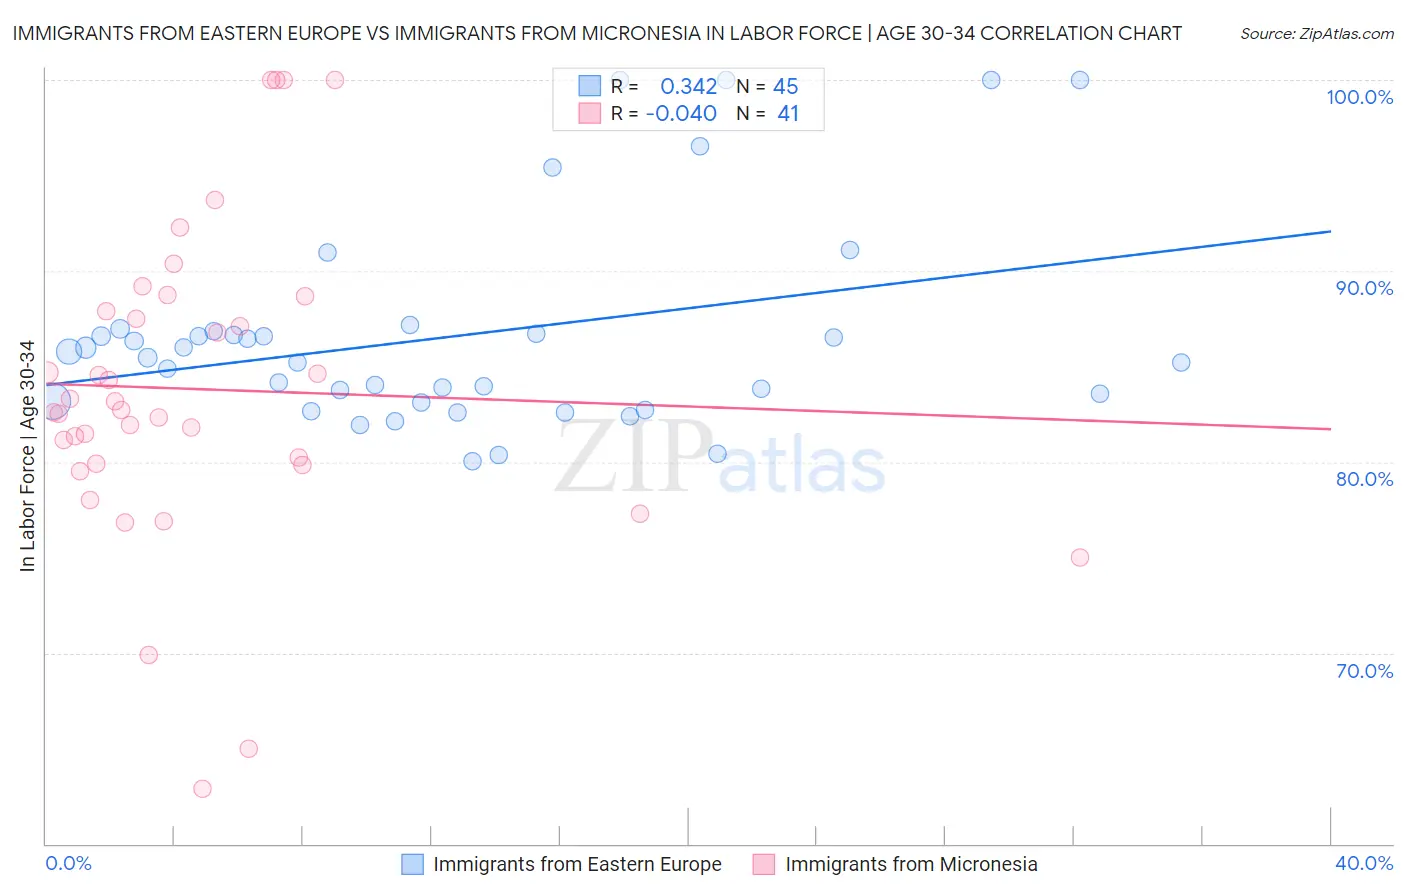
Immigrants from Eastern Europe vs Immigrants from Micronesia In Labor Force | Age 30-34 Correlation Chart
The statistical analysis conducted on geographies consisting of 475,379,259 people shows a mild positive correlation between the proportion of Immigrants from Eastern Europe and labor force participation rate among population between the ages 30 and 34 in the United States with a correlation coefficient (R) of 0.342 and weighted average of 85.4%. Similarly, the statistical analysis conducted on geographies consisting of 61,597,268 people shows no correlation between the proportion of Immigrants from Micronesia and labor force participation rate among population between the ages 30 and 34 in the United States with a correlation coefficient (R) of -0.040 and weighted average of 82.4%, a difference of 3.7%.
In Labor Force | Age 30-34 Correlation Summary
| Measurement | Immigrants from Eastern Europe | Immigrants from Micronesia |
| Minimum | 80.0% | 62.9% |
| Maximum | 100.0% | 100.0% |
| Range | 20.0% | 37.1% |
| Mean | 86.6% | 83.8% |
| Median | 85.4% | 82.7% |
| Interquartile 25% (IQ1) | 83.1% | 79.9% |
| Interquartile 75% (IQ3) | 86.8% | 88.3% |
| Interquartile Range (IQR) | 3.6% | 8.4% |
| Standard Deviation (Sample) | 5.4% | 8.3% |
| Standard Deviation (Population) | 5.3% | 8.1% |
Similar Demographics by In Labor Force | Age 30-34
Demographics Similar to Immigrants from Eastern Europe by In Labor Force | Age 30-34
In terms of in labor force | age 30-34, the demographic groups most similar to Immigrants from Eastern Europe are Ghanaian (85.4%, a difference of 0.010%), Kenyan (85.4%, a difference of 0.010%), Italian (85.4%, a difference of 0.020%), Senegalese (85.4%, a difference of 0.020%), and Macedonian (85.5%, a difference of 0.030%).
| Demographics | Rating | Rank | In Labor Force | Age 30-34 |
| Immigrants | Brazil | 99.5 /100 | #61 | Exceptional 85.5% |
| Soviet Union | 99.4 /100 | #62 | Exceptional 85.5% |
| Macedonians | 99.4 /100 | #63 | Exceptional 85.5% |
| Italians | 99.4 /100 | #64 | Exceptional 85.4% |
| Senegalese | 99.4 /100 | #65 | Exceptional 85.4% |
| Ghanaians | 99.4 /100 | #66 | Exceptional 85.4% |
| Kenyans | 99.3 /100 | #67 | Exceptional 85.4% |
| Immigrants | Eastern Europe | 99.3 /100 | #68 | Exceptional 85.4% |
| Immigrants | Iran | 99.2 /100 | #69 | Exceptional 85.4% |
| Brazilians | 99.1 /100 | #70 | Exceptional 85.4% |
| Immigrants | Japan | 99.1 /100 | #71 | Exceptional 85.4% |
| Immigrants | China | 99.0 /100 | #72 | Exceptional 85.4% |
| Indians (Asian) | 99.0 /100 | #73 | Exceptional 85.4% |
| Maltese | 99.0 /100 | #74 | Exceptional 85.4% |
| Immigrants | Czechoslovakia | 99.0 /100 | #75 | Exceptional 85.4% |
Demographics Similar to Immigrants from Micronesia by In Labor Force | Age 30-34
In terms of in labor force | age 30-34, the demographic groups most similar to Immigrants from Micronesia are Ottawa (82.4%, a difference of 0.010%), Hispanic or Latino (82.4%, a difference of 0.040%), Hmong (82.4%, a difference of 0.050%), Tlingit-Haida (82.3%, a difference of 0.080%), and Immigrants from Central America (82.5%, a difference of 0.11%).
| Demographics | Rating | Rank | In Labor Force | Age 30-34 |
| Chippewa | 0.0 /100 | #296 | Tragic 82.6% |
| Comanche | 0.0 /100 | #297 | Tragic 82.6% |
| Aleuts | 0.0 /100 | #298 | Tragic 82.6% |
| Immigrants | Central America | 0.0 /100 | #299 | Tragic 82.5% |
| Hmong | 0.0 /100 | #300 | Tragic 82.4% |
| Hispanics or Latinos | 0.0 /100 | #301 | Tragic 82.4% |
| Ottawa | 0.0 /100 | #302 | Tragic 82.4% |
| Immigrants | Micronesia | 0.0 /100 | #303 | Tragic 82.4% |
| Tlingit-Haida | 0.0 /100 | #304 | Tragic 82.3% |
| Osage | 0.0 /100 | #305 | Tragic 82.3% |
| Spanish American Indians | 0.0 /100 | #306 | Tragic 82.2% |
| Menominee | 0.0 /100 | #307 | Tragic 82.2% |
| Puget Sound Salish | 0.0 /100 | #308 | Tragic 82.1% |
| Immigrants | Mexico | 0.0 /100 | #309 | Tragic 82.0% |
| Cajuns | 0.0 /100 | #310 | Tragic 82.0% |