Immigrants from Eastern Asia vs Welsh In Labor Force | Age 45-54
COMPARE
Immigrants from Eastern Asia
Welsh
In Labor Force | Age 45-54
In Labor Force | Age 45-54 Comparison
Immigrants from Eastern Asia
Welsh
83.4%
IN LABOR FORCE | AGE 45-54
96.3/ 100
METRIC RATING
82nd/ 347
METRIC RANK
82.3%
IN LABOR FORCE | AGE 45-54
9.2/ 100
METRIC RATING
206th/ 347
METRIC RANK
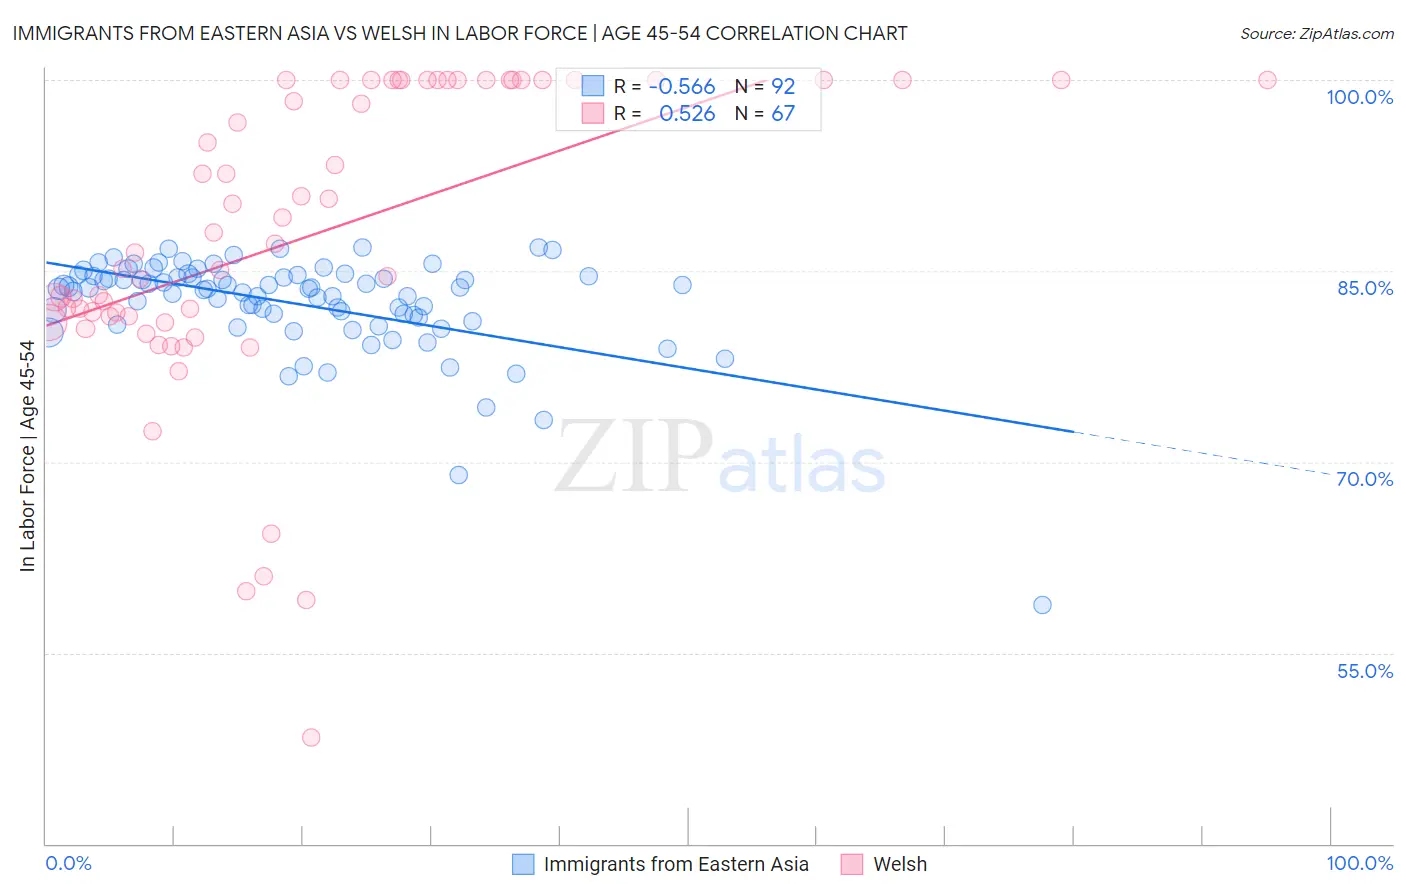
Immigrants from Eastern Asia vs Welsh In Labor Force | Age 45-54 Correlation Chart
The statistical analysis conducted on geographies consisting of 499,352,896 people shows a substantial negative correlation between the proportion of Immigrants from Eastern Asia and labor force participation rate among population between the ages 45 and 54 in the United States with a correlation coefficient (R) of -0.566 and weighted average of 83.4%. Similarly, the statistical analysis conducted on geographies consisting of 528,109,261 people shows a substantial positive correlation between the proportion of Welsh and labor force participation rate among population between the ages 45 and 54 in the United States with a correlation coefficient (R) of 0.526 and weighted average of 82.3%, a difference of 1.2%.
In Labor Force | Age 45-54 Correlation Summary
| Measurement | Immigrants from Eastern Asia | Welsh |
| Minimum | 58.8% | 48.4% |
| Maximum | 86.8% | 100.0% |
| Range | 28.0% | 51.6% |
| Mean | 82.4% | 87.7% |
| Median | 83.6% | 87.2% |
| Interquartile 25% (IQ1) | 81.5% | 81.4% |
| Interquartile 75% (IQ3) | 84.6% | 100.0% |
| Interquartile Range (IQR) | 3.1% | 18.6% |
| Standard Deviation (Sample) | 4.0% | 11.9% |
| Standard Deviation (Population) | 4.0% | 11.8% |
Similar Demographics by In Labor Force | Age 45-54
Demographics Similar to Immigrants from Eastern Asia by In Labor Force | Age 45-54
In terms of in labor force | age 45-54, the demographic groups most similar to Immigrants from Eastern Asia are Immigrants from Zimbabwe (83.4%, a difference of 0.0%), Immigrants from Croatia (83.4%, a difference of 0.010%), Jordanian (83.4%, a difference of 0.010%), Immigrants from Egypt (83.4%, a difference of 0.020%), and Belgian (83.4%, a difference of 0.020%).
| Demographics | Rating | Rank | In Labor Force | Age 45-54 |
| Estonians | 96.9 /100 | #75 | Exceptional 83.4% |
| Russians | 96.8 /100 | #76 | Exceptional 83.4% |
| Cubans | 96.7 /100 | #77 | Exceptional 83.4% |
| Immigrants | Egypt | 96.6 /100 | #78 | Exceptional 83.4% |
| Belgians | 96.5 /100 | #79 | Exceptional 83.4% |
| Immigrants | Croatia | 96.5 /100 | #80 | Exceptional 83.4% |
| Jordanians | 96.4 /100 | #81 | Exceptional 83.4% |
| Immigrants | Eastern Asia | 96.3 /100 | #82 | Exceptional 83.4% |
| Immigrants | Zimbabwe | 96.3 /100 | #83 | Exceptional 83.4% |
| Immigrants | Bosnia and Herzegovina | 96.0 /100 | #84 | Exceptional 83.3% |
| Greeks | 95.9 /100 | #85 | Exceptional 83.3% |
| Immigrants | Northern Africa | 95.7 /100 | #86 | Exceptional 83.3% |
| Immigrants | Eastern Europe | 95.6 /100 | #87 | Exceptional 83.3% |
| Immigrants | Asia | 95.6 /100 | #88 | Exceptional 83.3% |
| Indians (Asian) | 95.5 /100 | #89 | Exceptional 83.3% |
Demographics Similar to Welsh by In Labor Force | Age 45-54
In terms of in labor force | age 45-54, the demographic groups most similar to Welsh are Senegalese (82.4%, a difference of 0.010%), Immigrants from Cabo Verde (82.3%, a difference of 0.020%), Native Hawaiian (82.3%, a difference of 0.020%), Immigrants from Western Europe (82.4%, a difference of 0.040%), and Immigrants from Lebanon (82.3%, a difference of 0.050%).
| Demographics | Rating | Rank | In Labor Force | Age 45-54 |
| Moroccans | 15.7 /100 | #199 | Poor 82.5% |
| French Canadians | 15.4 /100 | #200 | Poor 82.5% |
| Canadians | 15.1 /100 | #201 | Poor 82.4% |
| Immigrants | Western Asia | 14.9 /100 | #202 | Poor 82.4% |
| Arabs | 11.6 /100 | #203 | Poor 82.4% |
| Immigrants | Western Europe | 10.9 /100 | #204 | Poor 82.4% |
| Senegalese | 9.5 /100 | #205 | Tragic 82.4% |
| Welsh | 9.2 /100 | #206 | Tragic 82.3% |
| Immigrants | Cabo Verde | 8.6 /100 | #207 | Tragic 82.3% |
| Native Hawaiians | 8.5 /100 | #208 | Tragic 82.3% |
| Immigrants | Lebanon | 7.4 /100 | #209 | Tragic 82.3% |
| Immigrants | Bahamas | 7.1 /100 | #210 | Tragic 82.3% |
| Immigrants | Syria | 6.6 /100 | #211 | Tragic 82.3% |
| Ecuadorians | 6.3 /100 | #212 | Tragic 82.3% |
| Immigrants | Uzbekistan | 5.8 /100 | #213 | Tragic 82.3% |