Japanese vs Ghanaian In Labor Force | Age 16-19
COMPARE
Japanese
Ghanaian
In Labor Force | Age 16-19
In Labor Force | Age 16-19 Comparison
Japanese
Ghanaians
37.5%
IN LABOR FORCE | AGE 16-19
89.3/ 100
METRIC RATING
144th/ 347
METRIC RANK
35.3%
IN LABOR FORCE | AGE 16-19
6.5/ 100
METRIC RATING
223rd/ 347
METRIC RANK
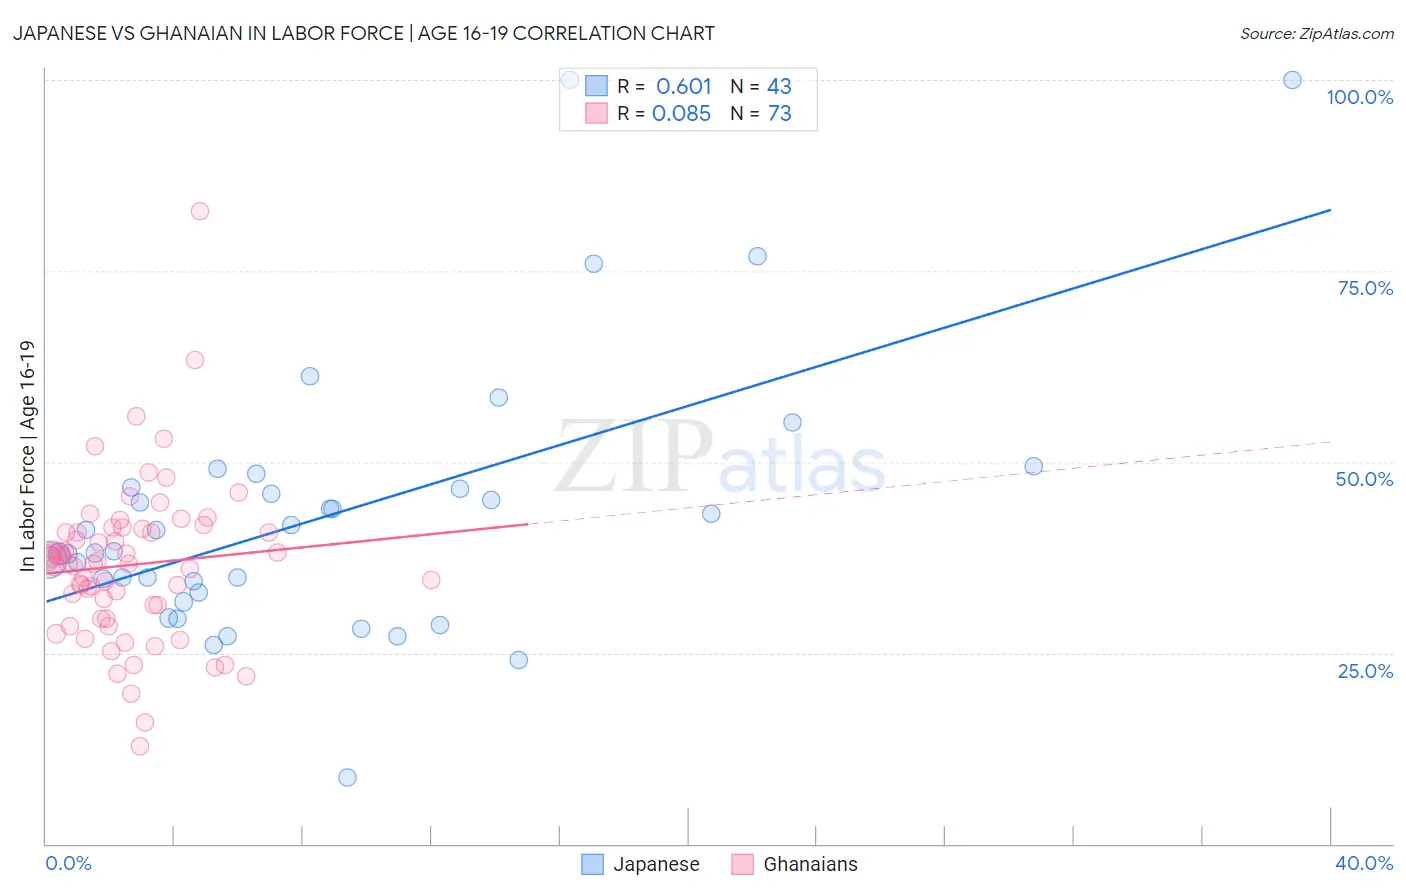
Japanese vs Ghanaian In Labor Force | Age 16-19 Correlation Chart
The statistical analysis conducted on geographies consisting of 249,091,187 people shows a significant positive correlation between the proportion of Japanese and labor force participation rate among population between the ages 16 and 19 in the United States with a correlation coefficient (R) of 0.601 and weighted average of 37.5%. Similarly, the statistical analysis conducted on geographies consisting of 190,615,931 people shows a slight positive correlation between the proportion of Ghanaians and labor force participation rate among population between the ages 16 and 19 in the United States with a correlation coefficient (R) of 0.085 and weighted average of 35.3%, a difference of 6.2%.
In Labor Force | Age 16-19 Correlation Summary
| Measurement | Japanese | Ghanaian |
| Minimum | 8.6% | 12.8% |
| Maximum | 100.0% | 82.8% |
| Range | 91.4% | 70.0% |
| Mean | 43.1% | 36.5% |
| Median | 38.2% | 36.7% |
| Interquartile 25% (IQ1) | 32.8% | 30.3% |
| Interquartile 75% (IQ3) | 46.7% | 41.0% |
| Interquartile Range (IQR) | 13.8% | 10.7% |
| Standard Deviation (Sample) | 17.9% | 10.4% |
| Standard Deviation (Population) | 17.7% | 10.4% |
Similar Demographics by In Labor Force | Age 16-19
Demographics Similar to Japanese by In Labor Force | Age 16-19
In terms of in labor force | age 16-19, the demographic groups most similar to Japanese are Paiute (37.5%, a difference of 0.0%), Pakistani (37.6%, a difference of 0.020%), Sierra Leonean (37.6%, a difference of 0.050%), Immigrants from Western Europe (37.5%, a difference of 0.050%), and Brazilian (37.5%, a difference of 0.080%).
| Demographics | Rating | Rank | In Labor Force | Age 16-19 |
| Cajuns | 93.2 /100 | #137 | Exceptional 37.8% |
| Comanche | 91.9 /100 | #138 | Exceptional 37.7% |
| Immigrants | Moldova | 91.9 /100 | #139 | Exceptional 37.7% |
| Estonians | 91.7 /100 | #140 | Exceptional 37.7% |
| Syrians | 90.7 /100 | #141 | Exceptional 37.6% |
| Sierra Leoneans | 89.7 /100 | #142 | Excellent 37.6% |
| Pakistanis | 89.5 /100 | #143 | Excellent 37.6% |
| Japanese | 89.3 /100 | #144 | Excellent 37.5% |
| Paiute | 89.3 /100 | #145 | Excellent 37.5% |
| Immigrants | Western Europe | 88.9 /100 | #146 | Excellent 37.5% |
| Brazilians | 88.7 /100 | #147 | Excellent 37.5% |
| Romanians | 87.3 /100 | #148 | Excellent 37.5% |
| Native Hawaiians | 85.0 /100 | #149 | Excellent 37.4% |
| Tsimshian | 84.7 /100 | #150 | Excellent 37.4% |
| Immigrants | Poland | 84.4 /100 | #151 | Excellent 37.3% |
Demographics Similar to Ghanaians by In Labor Force | Age 16-19
In terms of in labor force | age 16-19, the demographic groups most similar to Ghanaians are Honduran (35.3%, a difference of 0.020%), Immigrants from Belgium (35.3%, a difference of 0.090%), Immigrants from Ghana (35.4%, a difference of 0.15%), Turkish (35.4%, a difference of 0.16%), and Immigrants from Guatemala (35.3%, a difference of 0.19%).
| Demographics | Rating | Rank | In Labor Force | Age 16-19 |
| Dutch West Indians | 10.7 /100 | #216 | Poor 35.6% |
| Immigrants | Costa Rica | 10.7 /100 | #217 | Poor 35.6% |
| Sri Lankans | 9.8 /100 | #218 | Tragic 35.5% |
| Guatemalans | 8.6 /100 | #219 | Tragic 35.5% |
| Immigrants | Bahamas | 8.3 /100 | #220 | Tragic 35.5% |
| Turks | 7.3 /100 | #221 | Tragic 35.4% |
| Immigrants | Ghana | 7.3 /100 | #222 | Tragic 35.4% |
| Ghanaians | 6.5 /100 | #223 | Tragic 35.3% |
| Hondurans | 6.5 /100 | #224 | Tragic 35.3% |
| Immigrants | Belgium | 6.1 /100 | #225 | Tragic 35.3% |
| Immigrants | Guatemala | 5.7 /100 | #226 | Tragic 35.3% |
| Mongolians | 5.7 /100 | #227 | Tragic 35.3% |
| Immigrants | Senegal | 5.5 /100 | #228 | Tragic 35.3% |
| Immigrants | Lebanon | 5.0 /100 | #229 | Tragic 35.2% |
| Immigrants | Honduras | 4.9 /100 | #230 | Tragic 35.2% |