Immigrants from Dominica vs Immigrants from Hong Kong Single Mother Households
COMPARE
Immigrants from Dominica
Immigrants from Hong Kong
Single Mother Households
Single Mother Households Comparison
Immigrants from Dominica
Immigrants from Hong Kong
8.7%
SINGLE MOTHER HOUSEHOLDS
0.0/ 100
METRIC RATING
335th/ 347
METRIC RANK
4.8%
SINGLE MOTHER HOUSEHOLDS
100.0/ 100
METRIC RATING
5th/ 347
METRIC RANK
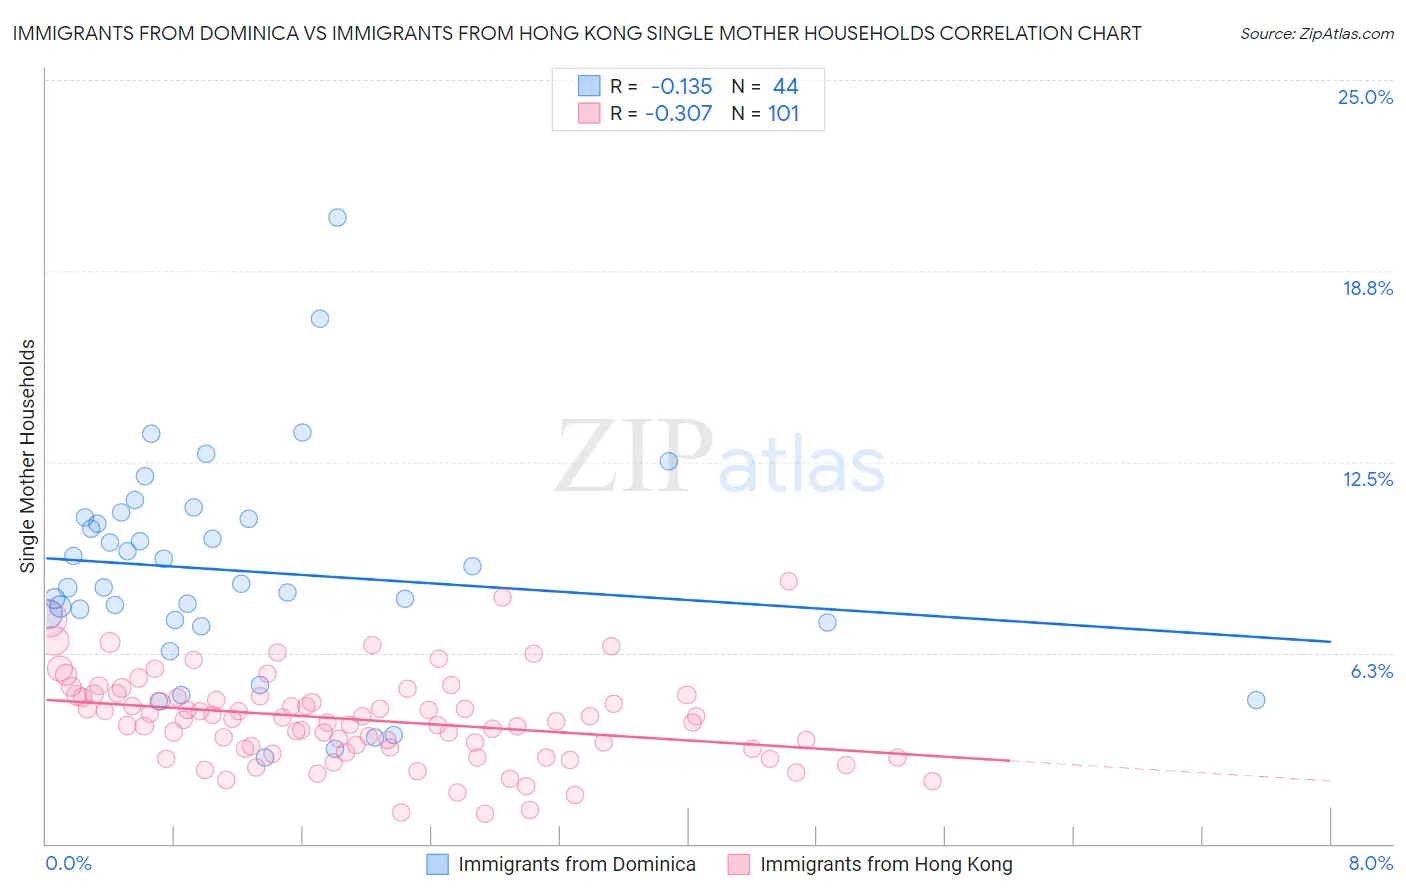
Immigrants from Dominica vs Immigrants from Hong Kong Single Mother Households Correlation Chart
The statistical analysis conducted on geographies consisting of 83,777,287 people shows a poor negative correlation between the proportion of Immigrants from Dominica and percentage of single mother households in the United States with a correlation coefficient (R) of -0.135 and weighted average of 8.7%. Similarly, the statistical analysis conducted on geographies consisting of 253,414,911 people shows a mild negative correlation between the proportion of Immigrants from Hong Kong and percentage of single mother households in the United States with a correlation coefficient (R) of -0.307 and weighted average of 4.8%, a difference of 80.7%.
Single Mother Households Correlation Summary
| Measurement | Immigrants from Dominica | Immigrants from Hong Kong |
| Minimum | 2.8% | 0.98% |
| Maximum | 20.5% | 8.6% |
| Range | 17.7% | 7.6% |
| Mean | 8.9% | 4.1% |
| Median | 8.5% | 4.1% |
| Interquartile 25% (IQ1) | 7.3% | 3.1% |
| Interquartile 75% (IQ3) | 10.7% | 4.8% |
| Interquartile Range (IQR) | 3.4% | 1.7% |
| Standard Deviation (Sample) | 3.5% | 1.4% |
| Standard Deviation (Population) | 3.5% | 1.4% |
Similar Demographics by Single Mother Households
Demographics Similar to Immigrants from Dominica by Single Mother Households
In terms of single mother households, the demographic groups most similar to Immigrants from Dominica are Puerto Rican (8.7%, a difference of 0.040%), Immigrants from Liberia (8.7%, a difference of 0.29%), Liberian (8.6%, a difference of 1.1%), Navajo (8.8%, a difference of 1.2%), and Cape Verdean (8.9%, a difference of 1.3%).
| Demographics | Rating | Rank | Single Mother Households |
| Yakama | 0.0 /100 | #328 | Tragic 8.4% |
| Hopi | 0.0 /100 | #329 | Tragic 8.5% |
| Inupiat | 0.0 /100 | #330 | Tragic 8.5% |
| Sioux | 0.0 /100 | #331 | Tragic 8.5% |
| U.S. Virgin Islanders | 0.0 /100 | #332 | Tragic 8.6% |
| Liberians | 0.0 /100 | #333 | Tragic 8.6% |
| Immigrants | Liberia | 0.0 /100 | #334 | Tragic 8.7% |
| Immigrants | Dominica | 0.0 /100 | #335 | Tragic 8.7% |
| Puerto Ricans | 0.0 /100 | #336 | Tragic 8.7% |
| Navajo | 0.0 /100 | #337 | Tragic 8.8% |
| Cape Verdeans | 0.0 /100 | #338 | Tragic 8.9% |
| Blacks/African Americans | 0.0 /100 | #339 | Tragic 9.0% |
| Lumbee | 0.0 /100 | #340 | Tragic 9.1% |
| Tohono O'odham | 0.0 /100 | #341 | Tragic 9.1% |
| Menominee | 0.0 /100 | #342 | Tragic 9.2% |
Demographics Similar to Immigrants from Hong Kong by Single Mother Households
In terms of single mother households, the demographic groups most similar to Immigrants from Hong Kong are Assyrian/Chaldean/Syriac (4.8%, a difference of 0.52%), Immigrants from Iran (4.8%, a difference of 0.60%), Immigrants from Singapore (5.0%, a difference of 2.6%), Iranian (5.0%, a difference of 2.8%), and Filipino (4.7%, a difference of 3.0%).
| Demographics | Rating | Rank | Single Mother Households |
| Immigrants | Taiwan | 100.0 /100 | #1 | Exceptional 4.7% |
| Filipinos | 100.0 /100 | #2 | Exceptional 4.7% |
| Immigrants | Iran | 100.0 /100 | #3 | Exceptional 4.8% |
| Assyrians/Chaldeans/Syriacs | 100.0 /100 | #4 | Exceptional 4.8% |
| Immigrants | Hong Kong | 100.0 /100 | #5 | Exceptional 4.8% |
| Immigrants | Singapore | 100.0 /100 | #6 | Exceptional 5.0% |
| Iranians | 100.0 /100 | #7 | Exceptional 5.0% |
| Immigrants | Ireland | 99.9 /100 | #8 | Exceptional 5.0% |
| Okinawans | 99.9 /100 | #9 | Exceptional 5.0% |
| Immigrants | Israel | 99.9 /100 | #10 | Exceptional 5.0% |
| Immigrants | China | 99.9 /100 | #11 | Exceptional 5.1% |
| Cypriots | 99.9 /100 | #12 | Exceptional 5.1% |
| Immigrants | India | 99.9 /100 | #13 | Exceptional 5.1% |
| Immigrants | Australia | 99.9 /100 | #14 | Exceptional 5.1% |
| Immigrants | Eastern Asia | 99.9 /100 | #15 | Exceptional 5.1% |