Immigrants from Denmark vs Spanish American In Labor Force | Age 25-29
COMPARE
Immigrants from Denmark
Spanish American
In Labor Force | Age 25-29
In Labor Force | Age 25-29 Comparison
Immigrants from Denmark
Spanish Americans
84.6%
IN LABOR FORCE | AGE 25-29
37.0/ 100
METRIC RATING
185th/ 347
METRIC RANK
83.4%
IN LABOR FORCE | AGE 25-29
0.0/ 100
METRIC RATING
267th/ 347
METRIC RANK
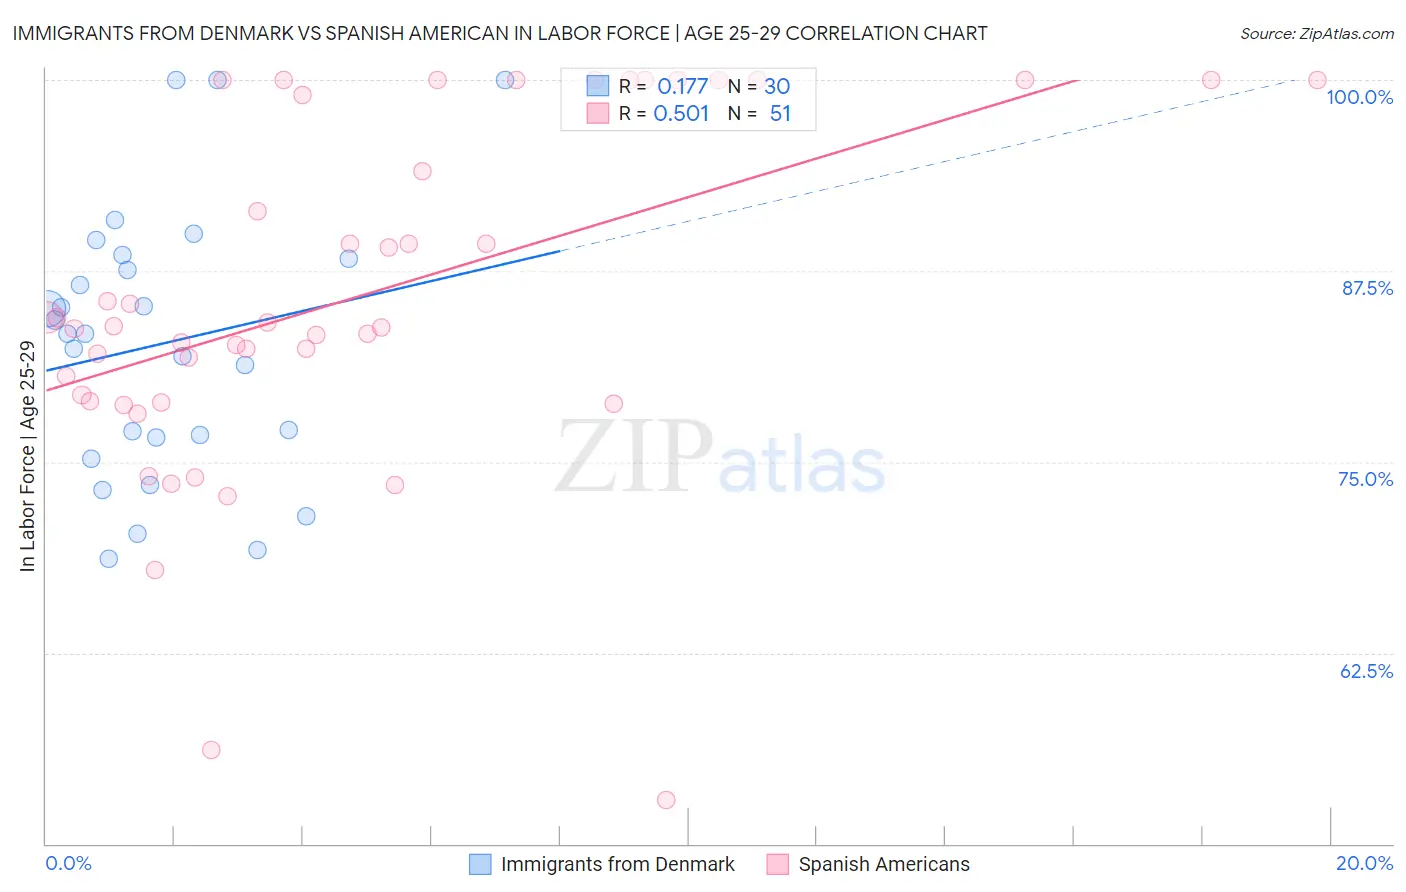
Immigrants from Denmark vs Spanish American In Labor Force | Age 25-29 Correlation Chart
The statistical analysis conducted on geographies consisting of 136,409,678 people shows a poor positive correlation between the proportion of Immigrants from Denmark and labor force participation rate among population between the ages 25 and 29 in the United States with a correlation coefficient (R) of 0.177 and weighted average of 84.6%. Similarly, the statistical analysis conducted on geographies consisting of 103,156,103 people shows a substantial positive correlation between the proportion of Spanish Americans and labor force participation rate among population between the ages 25 and 29 in the United States with a correlation coefficient (R) of 0.501 and weighted average of 83.4%, a difference of 1.4%.
In Labor Force | Age 25-29 Correlation Summary
| Measurement | Immigrants from Denmark | Spanish American |
| Minimum | 68.7% | 52.9% |
| Maximum | 100.0% | 100.0% |
| Range | 31.3% | 47.1% |
| Mean | 82.7% | 85.8% |
| Median | 83.4% | 83.9% |
| Interquartile 25% (IQ1) | 76.6% | 79.0% |
| Interquartile 75% (IQ3) | 88.3% | 100.0% |
| Interquartile Range (IQR) | 11.7% | 21.0% |
| Standard Deviation (Sample) | 8.7% | 11.3% |
| Standard Deviation (Population) | 8.6% | 11.2% |
Similar Demographics by In Labor Force | Age 25-29
Demographics Similar to Immigrants from Denmark by In Labor Force | Age 25-29
In terms of in labor force | age 25-29, the demographic groups most similar to Immigrants from Denmark are Immigrants from Kuwait (84.6%, a difference of 0.010%), Scottish (84.6%, a difference of 0.020%), Immigrants from Belgium (84.6%, a difference of 0.020%), Immigrants from Portugal (84.6%, a difference of 0.020%), and European (84.6%, a difference of 0.030%).
| Demographics | Rating | Rank | In Labor Force | Age 25-29 |
| Immigrants | Thailand | 45.2 /100 | #178 | Average 84.6% |
| Immigrants | Argentina | 44.0 /100 | #179 | Average 84.6% |
| Immigrants | South America | 42.9 /100 | #180 | Average 84.6% |
| Immigrants | Norway | 41.9 /100 | #181 | Average 84.6% |
| Europeans | 40.3 /100 | #182 | Average 84.6% |
| Scottish | 40.1 /100 | #183 | Average 84.6% |
| Immigrants | Kuwait | 38.2 /100 | #184 | Fair 84.6% |
| Immigrants | Denmark | 37.0 /100 | #185 | Fair 84.6% |
| Immigrants | Belgium | 35.0 /100 | #186 | Fair 84.6% |
| Immigrants | Portugal | 34.7 /100 | #187 | Fair 84.6% |
| Immigrants | Ukraine | 33.7 /100 | #188 | Fair 84.5% |
| Moroccans | 32.6 /100 | #189 | Fair 84.5% |
| Welsh | 31.1 /100 | #190 | Fair 84.5% |
| Zimbabweans | 28.7 /100 | #191 | Fair 84.5% |
| English | 25.8 /100 | #192 | Fair 84.5% |
Demographics Similar to Spanish Americans by In Labor Force | Age 25-29
In terms of in labor force | age 25-29, the demographic groups most similar to Spanish Americans are Aleut (83.4%, a difference of 0.010%), Immigrants from Lebanon (83.4%, a difference of 0.010%), Immigrants from Barbados (83.4%, a difference of 0.010%), Basque (83.4%, a difference of 0.020%), and Puget Sound Salish (83.5%, a difference of 0.050%).
| Demographics | Rating | Rank | In Labor Force | Age 25-29 |
| Immigrants | Bahamas | 0.1 /100 | #260 | Tragic 83.6% |
| Pennsylvania Germans | 0.1 /100 | #261 | Tragic 83.6% |
| Immigrants | Fiji | 0.1 /100 | #262 | Tragic 83.6% |
| West Indians | 0.1 /100 | #263 | Tragic 83.5% |
| Puget Sound Salish | 0.1 /100 | #264 | Tragic 83.5% |
| Cubans | 0.1 /100 | #265 | Tragic 83.5% |
| Aleuts | 0.0 /100 | #266 | Tragic 83.4% |
| Spanish Americans | 0.0 /100 | #267 | Tragic 83.4% |
| Immigrants | Lebanon | 0.0 /100 | #268 | Tragic 83.4% |
| Immigrants | Barbados | 0.0 /100 | #269 | Tragic 83.4% |
| Basques | 0.0 /100 | #270 | Tragic 83.4% |
| Hondurans | 0.0 /100 | #271 | Tragic 83.4% |
| Immigrants | Caribbean | 0.0 /100 | #272 | Tragic 83.4% |
| Immigrants | Dominica | 0.0 /100 | #273 | Tragic 83.4% |
| Marshallese | 0.0 /100 | #274 | Tragic 83.3% |