Immigrants from Denmark vs Spanish American Vision Disability
COMPARE
Immigrants from Denmark
Spanish American
Vision Disability
Vision Disability Comparison
Immigrants from Denmark
Spanish Americans
2.1%
VISION DISABILITY
92.9/ 100
METRIC RATING
112th/ 347
METRIC RANK
2.9%
VISION DISABILITY
0.0/ 100
METRIC RATING
326th/ 347
METRIC RANK
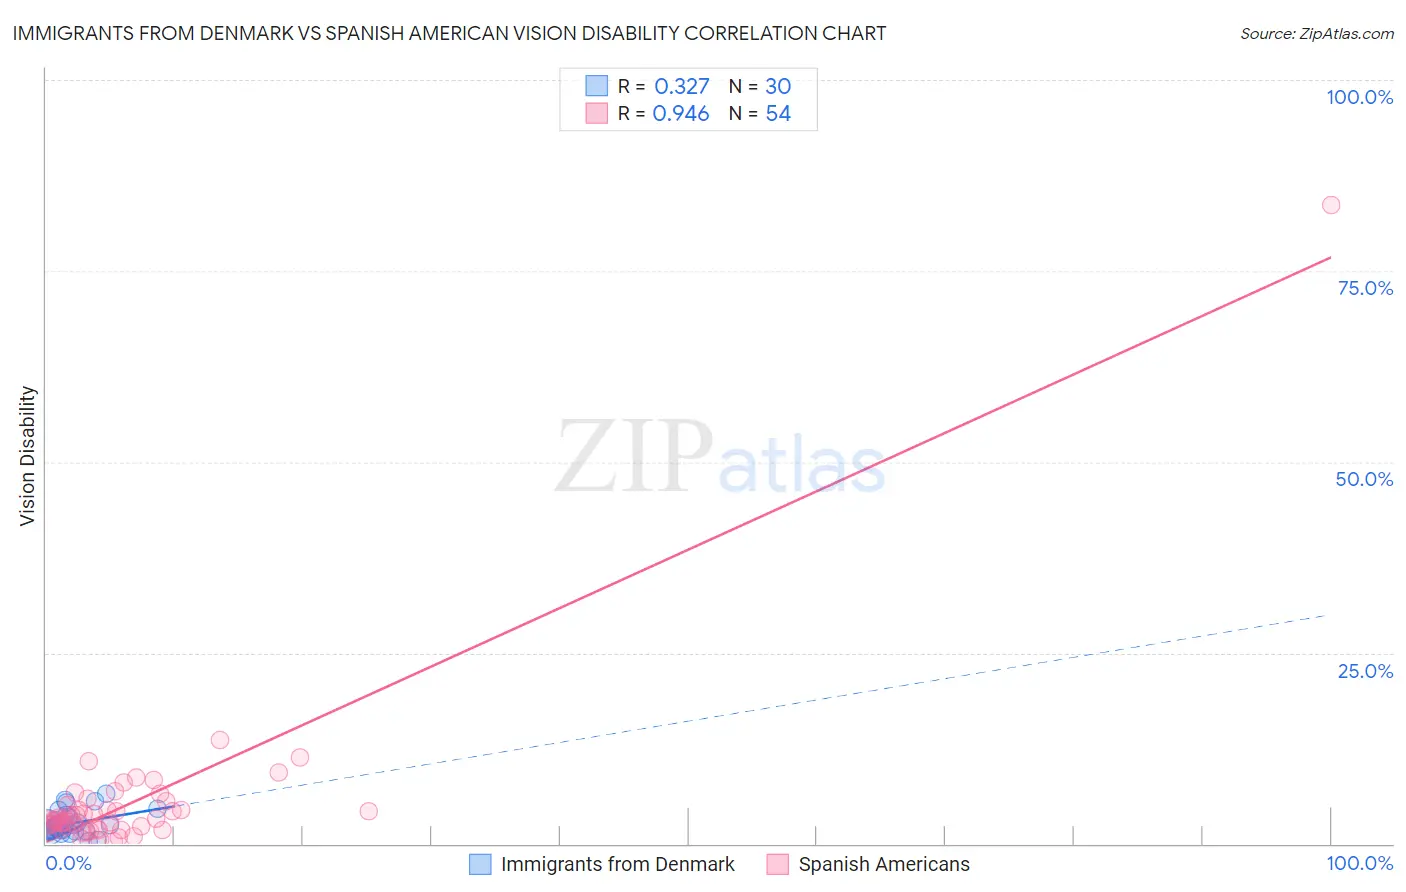
Immigrants from Denmark vs Spanish American Vision Disability Correlation Chart
The statistical analysis conducted on geographies consisting of 136,398,584 people shows a mild positive correlation between the proportion of Immigrants from Denmark and percentage of population with vision disability in the United States with a correlation coefficient (R) of 0.327 and weighted average of 2.1%. Similarly, the statistical analysis conducted on geographies consisting of 103,153,251 people shows a near-perfect positive correlation between the proportion of Spanish Americans and percentage of population with vision disability in the United States with a correlation coefficient (R) of 0.946 and weighted average of 2.9%, a difference of 41.7%.
Vision Disability Correlation Summary
| Measurement | Immigrants from Denmark | Spanish American |
| Minimum | 0.25% | 0.38% |
| Maximum | 6.5% | 83.6% |
| Range | 6.2% | 83.3% |
| Mean | 2.7% | 5.5% |
| Median | 2.2% | 3.3% |
| Interquartile 25% (IQ1) | 1.7% | 2.3% |
| Interquartile 75% (IQ3) | 3.4% | 5.0% |
| Interquartile Range (IQR) | 1.7% | 2.7% |
| Standard Deviation (Sample) | 1.6% | 11.2% |
| Standard Deviation (Population) | 1.6% | 11.1% |
Similar Demographics by Vision Disability
Demographics Similar to Immigrants from Denmark by Vision Disability
In terms of vision disability, the demographic groups most similar to Immigrants from Denmark are Kenyan (2.1%, a difference of 0.12%), Croatian (2.1%, a difference of 0.15%), Peruvian (2.1%, a difference of 0.16%), Immigrants from Vietnam (2.1%, a difference of 0.18%), and Ugandan (2.1%, a difference of 0.18%).
| Demographics | Rating | Rank | Vision Disability |
| Carpatho Rusyns | 94.3 /100 | #105 | Exceptional 2.1% |
| Swedes | 94.2 /100 | #106 | Exceptional 2.1% |
| Danes | 94.2 /100 | #107 | Exceptional 2.1% |
| Koreans | 94.1 /100 | #108 | Exceptional 2.1% |
| Chileans | 94.0 /100 | #109 | Exceptional 2.1% |
| Immigrants | Armenia | 93.8 /100 | #110 | Exceptional 2.1% |
| Peruvians | 93.5 /100 | #111 | Exceptional 2.1% |
| Immigrants | Denmark | 92.9 /100 | #112 | Exceptional 2.1% |
| Kenyans | 92.5 /100 | #113 | Exceptional 2.1% |
| Croatians | 92.3 /100 | #114 | Exceptional 2.1% |
| Immigrants | Vietnam | 92.2 /100 | #115 | Exceptional 2.1% |
| Ugandans | 92.2 /100 | #116 | Exceptional 2.1% |
| Poles | 92.0 /100 | #117 | Exceptional 2.1% |
| Immigrants | Philippines | 91.4 /100 | #118 | Exceptional 2.1% |
| Immigrants | Uganda | 91.4 /100 | #119 | Exceptional 2.1% |
Demographics Similar to Spanish Americans by Vision Disability
In terms of vision disability, the demographic groups most similar to Spanish Americans are Native/Alaskan (3.0%, a difference of 0.80%), Cherokee (2.9%, a difference of 1.2%), Hopi (2.9%, a difference of 1.2%), Yuman (3.0%, a difference of 1.3%), and Apache (3.0%, a difference of 1.5%).
| Demographics | Rating | Rank | Vision Disability |
| Tohono O'odham | 0.0 /100 | #319 | Tragic 2.8% |
| Blacks/African Americans | 0.0 /100 | #320 | Tragic 2.8% |
| Comanche | 0.0 /100 | #321 | Tragic 2.8% |
| Paiute | 0.0 /100 | #322 | Tragic 2.9% |
| Tlingit-Haida | 0.0 /100 | #323 | Tragic 2.9% |
| Hopi | 0.0 /100 | #324 | Tragic 2.9% |
| Cherokee | 0.0 /100 | #325 | Tragic 2.9% |
| Spanish Americans | 0.0 /100 | #326 | Tragic 2.9% |
| Natives/Alaskans | 0.0 /100 | #327 | Tragic 3.0% |
| Yuman | 0.0 /100 | #328 | Tragic 3.0% |
| Apache | 0.0 /100 | #329 | Tragic 3.0% |
| Colville | 0.0 /100 | #330 | Tragic 3.0% |
| Central American Indians | 0.0 /100 | #331 | Tragic 3.0% |
| Seminole | 0.0 /100 | #332 | Tragic 3.1% |
| Cajuns | 0.0 /100 | #333 | Tragic 3.1% |