Mexican American Indian vs Spanish American In Labor Force | Age 25-29
COMPARE
Mexican American Indian
Spanish American
In Labor Force | Age 25-29
In Labor Force | Age 25-29 Comparison
Mexican American Indians
Spanish Americans
83.0%
IN LABOR FORCE | AGE 25-29
0.0/ 100
METRIC RATING
286th/ 347
METRIC RANK
83.4%
IN LABOR FORCE | AGE 25-29
0.0/ 100
METRIC RATING
267th/ 347
METRIC RANK
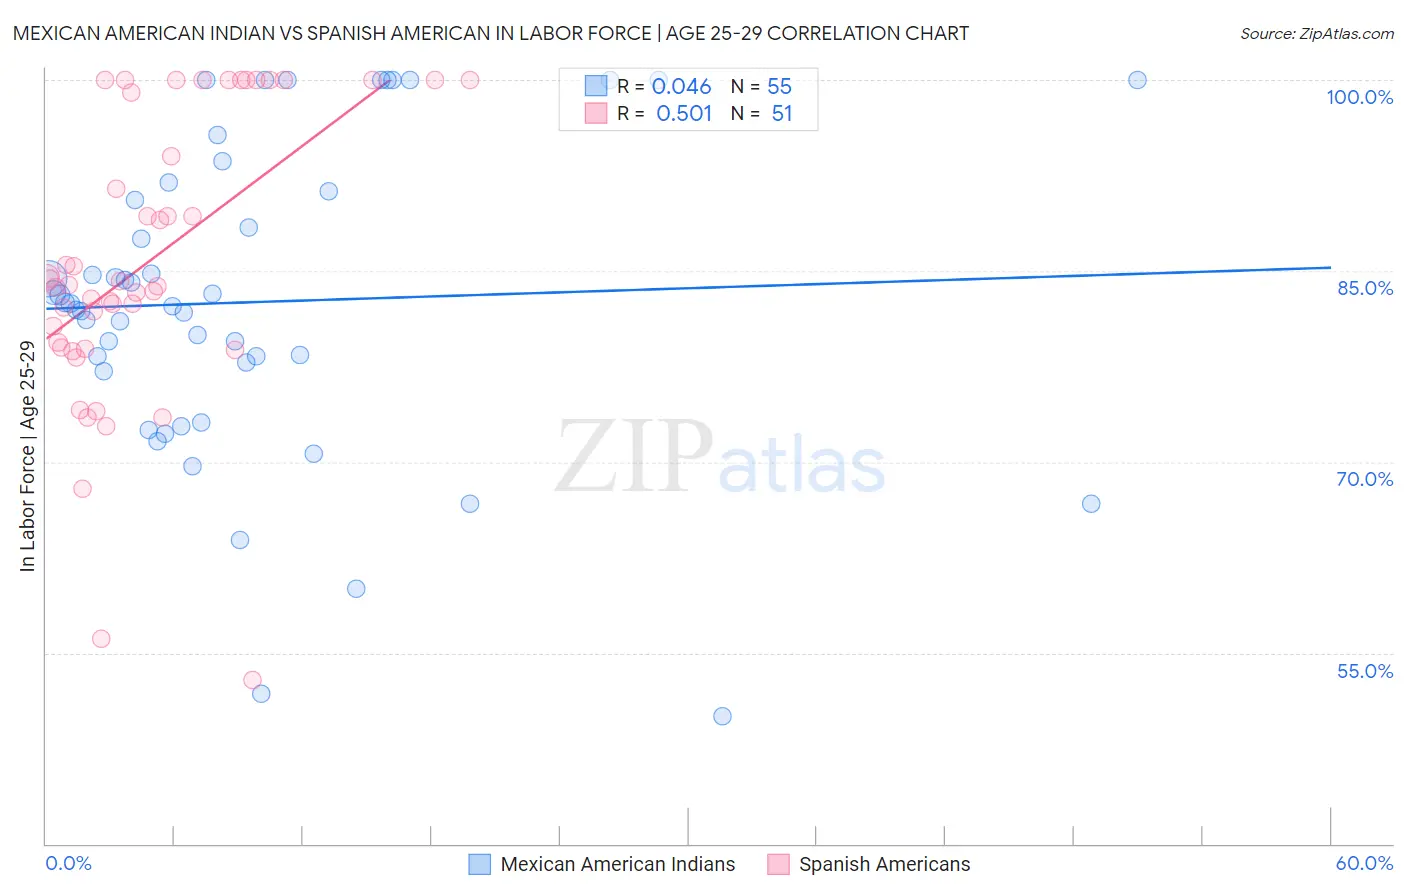
Mexican American Indian vs Spanish American In Labor Force | Age 25-29 Correlation Chart
The statistical analysis conducted on geographies consisting of 317,545,918 people shows no correlation between the proportion of Mexican American Indians and labor force participation rate among population between the ages 25 and 29 in the United States with a correlation coefficient (R) of 0.046 and weighted average of 83.0%. Similarly, the statistical analysis conducted on geographies consisting of 103,156,103 people shows a substantial positive correlation between the proportion of Spanish Americans and labor force participation rate among population between the ages 25 and 29 in the United States with a correlation coefficient (R) of 0.501 and weighted average of 83.4%, a difference of 0.45%.
In Labor Force | Age 25-29 Correlation Summary
| Measurement | Mexican American Indian | Spanish American |
| Minimum | 50.0% | 52.9% |
| Maximum | 100.0% | 100.0% |
| Range | 50.0% | 47.1% |
| Mean | 82.6% | 85.8% |
| Median | 82.4% | 83.9% |
| Interquartile 25% (IQ1) | 77.2% | 79.0% |
| Interquartile 75% (IQ3) | 91.3% | 100.0% |
| Interquartile Range (IQR) | 14.1% | 21.0% |
| Standard Deviation (Sample) | 12.2% | 11.3% |
| Standard Deviation (Population) | 12.0% | 11.2% |
Demographics Similar to Mexican American Indians and Spanish Americans by In Labor Force | Age 25-29
In terms of in labor force | age 25-29, the demographic groups most similar to Mexican American Indians are Belizean (83.1%, a difference of 0.020%), Nicaraguan (83.1%, a difference of 0.050%), American (83.1%, a difference of 0.070%), Immigrants from the Azores (83.1%, a difference of 0.070%), and Immigrants from Dominican Republic (83.1%, a difference of 0.080%). Similarly, the demographic groups most similar to Spanish Americans are Aleut (83.4%, a difference of 0.010%), Immigrants from Lebanon (83.4%, a difference of 0.010%), Immigrants from Barbados (83.4%, a difference of 0.010%), Basque (83.4%, a difference of 0.020%), and Honduran (83.4%, a difference of 0.050%).
| Demographics | Rating | Rank | In Labor Force | Age 25-29 |
| Aleuts | 0.0 /100 | #266 | Tragic 83.4% |
| Spanish Americans | 0.0 /100 | #267 | Tragic 83.4% |
| Immigrants | Lebanon | 0.0 /100 | #268 | Tragic 83.4% |
| Immigrants | Barbados | 0.0 /100 | #269 | Tragic 83.4% |
| Basques | 0.0 /100 | #270 | Tragic 83.4% |
| Hondurans | 0.0 /100 | #271 | Tragic 83.4% |
| Immigrants | Caribbean | 0.0 /100 | #272 | Tragic 83.4% |
| Immigrants | Dominica | 0.0 /100 | #273 | Tragic 83.4% |
| Marshallese | 0.0 /100 | #274 | Tragic 83.3% |
| Samoans | 0.0 /100 | #275 | Tragic 83.3% |
| Immigrants | Honduras | 0.0 /100 | #276 | Tragic 83.3% |
| Africans | 0.0 /100 | #277 | Tragic 83.2% |
| Immigrants | Cuba | 0.0 /100 | #278 | Tragic 83.2% |
| British West Indians | 0.0 /100 | #279 | Tragic 83.2% |
| Dominicans | 0.0 /100 | #280 | Tragic 83.2% |
| Immigrants | Dominican Republic | 0.0 /100 | #281 | Tragic 83.1% |
| Americans | 0.0 /100 | #282 | Tragic 83.1% |
| Immigrants | Azores | 0.0 /100 | #283 | Tragic 83.1% |
| Nicaraguans | 0.0 /100 | #284 | Tragic 83.1% |
| Belizeans | 0.0 /100 | #285 | Tragic 83.1% |
| Mexican American Indians | 0.0 /100 | #286 | Tragic 83.0% |