Immigrants from Denmark vs Spanish American Disability Age Over 75
COMPARE
Immigrants from Denmark
Spanish American
Disability Age Over 75
Disability Age Over 75 Comparison
Immigrants from Denmark
Spanish Americans
45.4%
DISABILITY AGE OVER 75
99.9/ 100
METRIC RATING
30th/ 347
METRIC RANK
50.0%
DISABILITY AGE OVER 75
0.0/ 100
METRIC RATING
295th/ 347
METRIC RANK
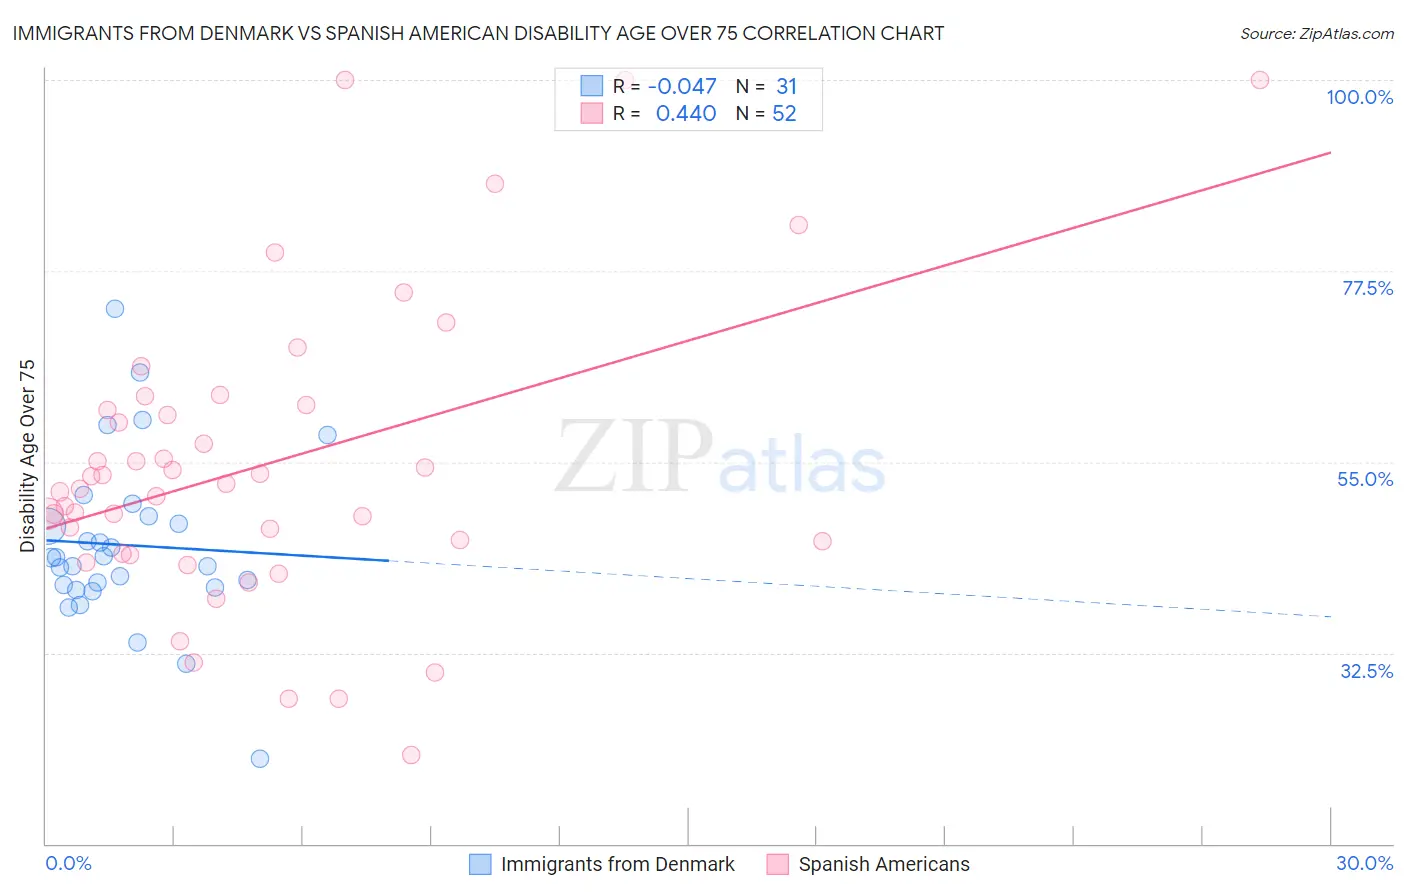
Immigrants from Denmark vs Spanish American Disability Age Over 75 Correlation Chart
The statistical analysis conducted on geographies consisting of 136,379,730 people shows no correlation between the proportion of Immigrants from Denmark and percentage of population with a disability over the age of 75 in the United States with a correlation coefficient (R) of -0.047 and weighted average of 45.4%. Similarly, the statistical analysis conducted on geographies consisting of 103,158,462 people shows a moderate positive correlation between the proportion of Spanish Americans and percentage of population with a disability over the age of 75 in the United States with a correlation coefficient (R) of 0.440 and weighted average of 50.0%, a difference of 10.1%.
Disability Age Over 75 Correlation Summary
| Measurement | Immigrants from Denmark | Spanish American |
| Minimum | 20.0% | 20.5% |
| Maximum | 73.0% | 100.0% |
| Range | 53.0% | 79.5% |
| Mean | 45.2% | 54.7% |
| Median | 43.7% | 52.1% |
| Interquartile 25% (IQ1) | 40.2% | 44.9% |
| Interquartile 75% (IQ3) | 48.6% | 61.4% |
| Interquartile Range (IQR) | 8.4% | 16.4% |
| Standard Deviation (Sample) | 10.2% | 17.6% |
| Standard Deviation (Population) | 10.0% | 17.5% |
Similar Demographics by Disability Age Over 75
Demographics Similar to Immigrants from Denmark by Disability Age Over 75
In terms of disability age over 75, the demographic groups most similar to Immigrants from Denmark are Filipino (45.4%, a difference of 0.030%), Thai (45.4%, a difference of 0.070%), Immigrants from Bulgaria (45.5%, a difference of 0.070%), Immigrants from Poland (45.4%, a difference of 0.090%), and Macedonian (45.4%, a difference of 0.10%).
| Demographics | Rating | Rank | Disability Age Over 75 |
| Immigrants | Switzerland | 99.9 /100 | #23 | Exceptional 45.3% |
| Poles | 99.9 /100 | #24 | Exceptional 45.3% |
| Immigrants | Bolivia | 99.9 /100 | #25 | Exceptional 45.4% |
| Macedonians | 99.9 /100 | #26 | Exceptional 45.4% |
| Immigrants | Poland | 99.9 /100 | #27 | Exceptional 45.4% |
| Thais | 99.9 /100 | #28 | Exceptional 45.4% |
| Filipinos | 99.9 /100 | #29 | Exceptional 45.4% |
| Immigrants | Denmark | 99.9 /100 | #30 | Exceptional 45.4% |
| Immigrants | Bulgaria | 99.9 /100 | #31 | Exceptional 45.5% |
| Immigrants | Australia | 99.9 /100 | #32 | Exceptional 45.5% |
| Immigrants | Croatia | 99.9 /100 | #33 | Exceptional 45.5% |
| Russians | 99.9 /100 | #34 | Exceptional 45.5% |
| Norwegians | 99.9 /100 | #35 | Exceptional 45.5% |
| Immigrants | Taiwan | 99.9 /100 | #36 | Exceptional 45.5% |
| South Africans | 99.9 /100 | #37 | Exceptional 45.5% |
Demographics Similar to Spanish Americans by Disability Age Over 75
In terms of disability age over 75, the demographic groups most similar to Spanish Americans are Immigrants from Cambodia (50.0%, a difference of 0.040%), Mexican American Indian (50.0%, a difference of 0.040%), Armenian (50.0%, a difference of 0.060%), Marshallese (50.1%, a difference of 0.12%), and Spanish American Indian (49.9%, a difference of 0.16%).
| Demographics | Rating | Rank | Disability Age Over 75 |
| Yaqui | 0.0 /100 | #288 | Tragic 49.8% |
| Osage | 0.0 /100 | #289 | Tragic 49.8% |
| Puget Sound Salish | 0.0 /100 | #290 | Tragic 49.8% |
| Arapaho | 0.0 /100 | #291 | Tragic 49.8% |
| Shoshone | 0.0 /100 | #292 | Tragic 49.9% |
| Spanish American Indians | 0.0 /100 | #293 | Tragic 49.9% |
| Immigrants | Cambodia | 0.0 /100 | #294 | Tragic 50.0% |
| Spanish Americans | 0.0 /100 | #295 | Tragic 50.0% |
| Mexican American Indians | 0.0 /100 | #296 | Tragic 50.0% |
| Armenians | 0.0 /100 | #297 | Tragic 50.0% |
| Marshallese | 0.0 /100 | #298 | Tragic 50.1% |
| Immigrants | Micronesia | 0.0 /100 | #299 | Tragic 50.1% |
| Cape Verdeans | 0.0 /100 | #300 | Tragic 50.1% |
| Dominicans | 0.0 /100 | #301 | Tragic 50.2% |
| Cherokee | 0.0 /100 | #302 | Tragic 50.2% |