Immigrants from Denmark vs French American Indian In Labor Force | Age 25-29
COMPARE
Immigrants from Denmark
French American Indian
In Labor Force | Age 25-29
In Labor Force | Age 25-29 Comparison
Immigrants from Denmark
French American Indians
84.6%
IN LABOR FORCE | AGE 25-29
37.0/ 100
METRIC RATING
185th/ 347
METRIC RANK
84.2%
IN LABOR FORCE | AGE 25-29
5.5/ 100
METRIC RATING
227th/ 347
METRIC RANK
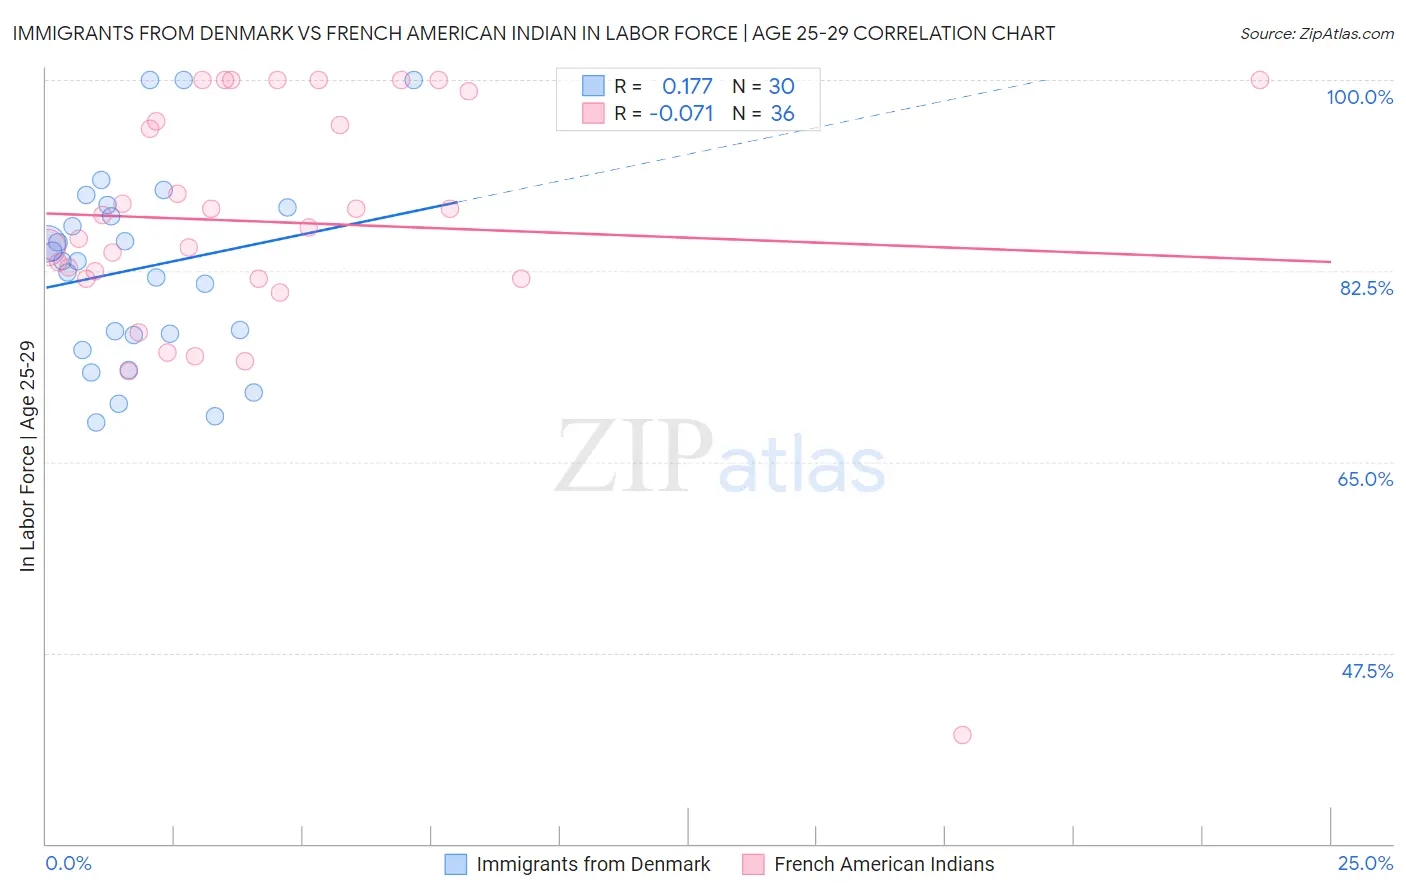
Immigrants from Denmark vs French American Indian In Labor Force | Age 25-29 Correlation Chart
The statistical analysis conducted on geographies consisting of 136,409,678 people shows a poor positive correlation between the proportion of Immigrants from Denmark and labor force participation rate among population between the ages 25 and 29 in the United States with a correlation coefficient (R) of 0.177 and weighted average of 84.6%. Similarly, the statistical analysis conducted on geographies consisting of 131,957,591 people shows a slight negative correlation between the proportion of French American Indians and labor force participation rate among population between the ages 25 and 29 in the United States with a correlation coefficient (R) of -0.071 and weighted average of 84.2%, a difference of 0.43%.
In Labor Force | Age 25-29 Correlation Summary
| Measurement | Immigrants from Denmark | French American Indian |
| Minimum | 68.7% | 40.0% |
| Maximum | 100.0% | 100.0% |
| Range | 31.3% | 60.0% |
| Mean | 82.7% | 87.0% |
| Median | 83.4% | 87.1% |
| Interquartile 25% (IQ1) | 76.6% | 81.8% |
| Interquartile 75% (IQ3) | 88.3% | 97.6% |
| Interquartile Range (IQR) | 11.7% | 15.8% |
| Standard Deviation (Sample) | 8.7% | 11.8% |
| Standard Deviation (Population) | 8.6% | 11.7% |
Similar Demographics by In Labor Force | Age 25-29
Demographics Similar to Immigrants from Denmark by In Labor Force | Age 25-29
In terms of in labor force | age 25-29, the demographic groups most similar to Immigrants from Denmark are Immigrants from Kuwait (84.6%, a difference of 0.010%), Scottish (84.6%, a difference of 0.020%), Immigrants from Belgium (84.6%, a difference of 0.020%), Immigrants from Portugal (84.6%, a difference of 0.020%), and European (84.6%, a difference of 0.030%).
| Demographics | Rating | Rank | In Labor Force | Age 25-29 |
| Immigrants | Thailand | 45.2 /100 | #178 | Average 84.6% |
| Immigrants | Argentina | 44.0 /100 | #179 | Average 84.6% |
| Immigrants | South America | 42.9 /100 | #180 | Average 84.6% |
| Immigrants | Norway | 41.9 /100 | #181 | Average 84.6% |
| Europeans | 40.3 /100 | #182 | Average 84.6% |
| Scottish | 40.1 /100 | #183 | Average 84.6% |
| Immigrants | Kuwait | 38.2 /100 | #184 | Fair 84.6% |
| Immigrants | Denmark | 37.0 /100 | #185 | Fair 84.6% |
| Immigrants | Belgium | 35.0 /100 | #186 | Fair 84.6% |
| Immigrants | Portugal | 34.7 /100 | #187 | Fair 84.6% |
| Immigrants | Ukraine | 33.7 /100 | #188 | Fair 84.5% |
| Moroccans | 32.6 /100 | #189 | Fair 84.5% |
| Welsh | 31.1 /100 | #190 | Fair 84.5% |
| Zimbabweans | 28.7 /100 | #191 | Fair 84.5% |
| English | 25.8 /100 | #192 | Fair 84.5% |
Demographics Similar to French American Indians by In Labor Force | Age 25-29
In terms of in labor force | age 25-29, the demographic groups most similar to French American Indians are Immigrants from Panama (84.2%, a difference of 0.0%), Korean (84.2%, a difference of 0.010%), Immigrants from Congo (84.2%, a difference of 0.010%), Immigrants from West Indies (84.2%, a difference of 0.020%), and Immigrants from Oceania (84.2%, a difference of 0.020%).
| Demographics | Rating | Rank | In Labor Force | Age 25-29 |
| Nigerians | 7.2 /100 | #220 | Tragic 84.3% |
| Arabs | 6.8 /100 | #221 | Tragic 84.2% |
| Jordanians | 6.7 /100 | #222 | Tragic 84.2% |
| Scotch-Irish | 6.5 /100 | #223 | Tragic 84.2% |
| Immigrants | West Indies | 6.0 /100 | #224 | Tragic 84.2% |
| Koreans | 5.9 /100 | #225 | Tragic 84.2% |
| Immigrants | Congo | 5.8 /100 | #226 | Tragic 84.2% |
| French American Indians | 5.5 /100 | #227 | Tragic 84.2% |
| Immigrants | Panama | 5.5 /100 | #228 | Tragic 84.2% |
| Immigrants | Oceania | 5.0 /100 | #229 | Tragic 84.2% |
| Whites/Caucasians | 4.8 /100 | #230 | Tragic 84.2% |
| Immigrants | Philippines | 4.7 /100 | #231 | Tragic 84.2% |
| Panamanians | 4.5 /100 | #232 | Tragic 84.2% |
| Immigrants | Western Asia | 2.7 /100 | #233 | Tragic 84.1% |
| Barbadians | 1.0 /100 | #234 | Tragic 83.9% |