Immigrants from Uzbekistan vs Lumbee In Labor Force | Age > 16
COMPARE
Immigrants from Uzbekistan
Lumbee
In Labor Force | Age > 16
In Labor Force | Age > 16 Comparison
Immigrants from Uzbekistan
Lumbee
64.3%
IN LABOR FORCE | AGE > 16
1.4/ 100
METRIC RATING
254th/ 347
METRIC RANK
56.8%
IN LABOR FORCE | AGE > 16
0.0/ 100
METRIC RATING
346th/ 347
METRIC RANK
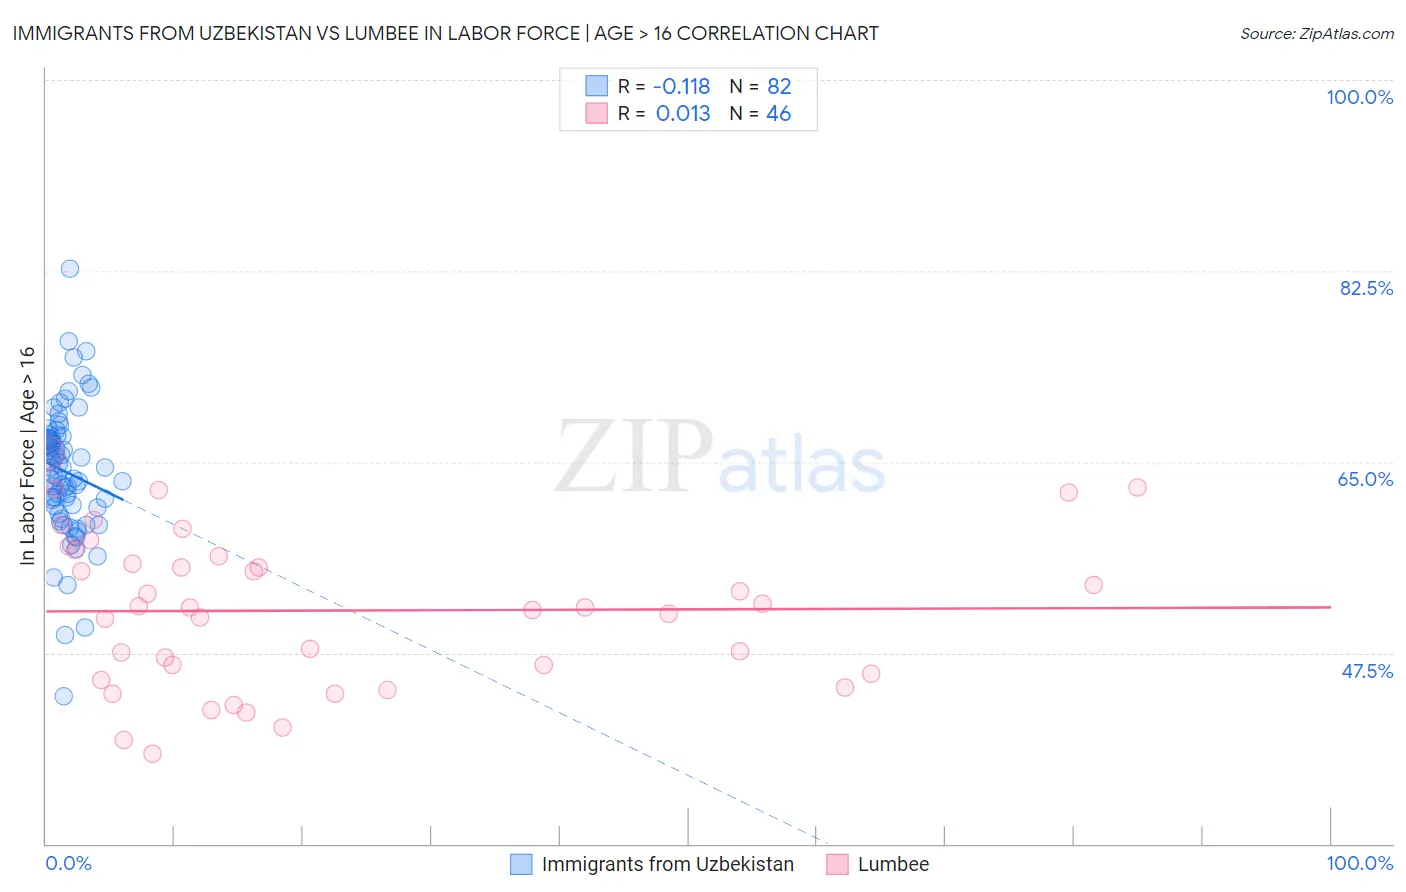
Immigrants from Uzbekistan vs Lumbee In Labor Force | Age > 16 Correlation Chart
The statistical analysis conducted on geographies consisting of 118,764,093 people shows a poor negative correlation between the proportion of Immigrants from Uzbekistan and labor force participation rate among population ages 16 and over in the United States with a correlation coefficient (R) of -0.118 and weighted average of 64.3%. Similarly, the statistical analysis conducted on geographies consisting of 92,293,168 people shows no correlation between the proportion of Lumbee and labor force participation rate among population ages 16 and over in the United States with a correlation coefficient (R) of 0.013 and weighted average of 56.8%, a difference of 13.4%.
In Labor Force | Age > 16 Correlation Summary
| Measurement | Immigrants from Uzbekistan | Lumbee |
| Minimum | 43.5% | 38.2% |
| Maximum | 82.7% | 65.7% |
| Range | 39.2% | 27.5% |
| Mean | 64.1% | 51.4% |
| Median | 64.5% | 51.7% |
| Interquartile 25% (IQ1) | 60.9% | 45.6% |
| Interquartile 75% (IQ3) | 67.1% | 56.4% |
| Interquartile Range (IQR) | 6.2% | 10.8% |
| Standard Deviation (Sample) | 6.0% | 7.0% |
| Standard Deviation (Population) | 6.0% | 6.9% |
Similar Demographics by In Labor Force | Age > 16
Demographics Similar to Immigrants from Uzbekistan by In Labor Force | Age > 16
In terms of in labor force | age > 16, the demographic groups most similar to Immigrants from Uzbekistan are Czechoslovakian (64.3%, a difference of 0.0%), Immigrants from Dominican Republic (64.4%, a difference of 0.010%), Portuguese (64.4%, a difference of 0.040%), British West Indian (64.4%, a difference of 0.060%), and German (64.4%, a difference of 0.070%).
| Demographics | Rating | Rank | In Labor Force | Age > 16 |
| Swiss | 2.1 /100 | #247 | Tragic 64.4% |
| Immigrants | Barbados | 2.1 /100 | #248 | Tragic 64.4% |
| Germans | 1.8 /100 | #249 | Tragic 64.4% |
| British West Indians | 1.8 /100 | #250 | Tragic 64.4% |
| Portuguese | 1.6 /100 | #251 | Tragic 64.4% |
| Immigrants | Dominican Republic | 1.5 /100 | #252 | Tragic 64.4% |
| Czechoslovakians | 1.4 /100 | #253 | Tragic 64.3% |
| Immigrants | Uzbekistan | 1.4 /100 | #254 | Tragic 64.3% |
| Hispanics or Latinos | 1.1 /100 | #255 | Tragic 64.3% |
| Immigrants | Mexico | 1.0 /100 | #256 | Tragic 64.3% |
| Inupiat | 0.8 /100 | #257 | Tragic 64.3% |
| Immigrants | Scotland | 0.8 /100 | #258 | Tragic 64.2% |
| Immigrants | Western Europe | 0.7 /100 | #259 | Tragic 64.2% |
| Marshallese | 0.7 /100 | #260 | Tragic 64.2% |
| Basques | 0.7 /100 | #261 | Tragic 64.2% |
Demographics Similar to Lumbee by In Labor Force | Age > 16
In terms of in labor force | age > 16, the demographic groups most similar to Lumbee are Navajo (56.6%, a difference of 0.31%), Tohono O'odham (57.2%, a difference of 0.85%), Pima (57.4%, a difference of 1.1%), Yuman (57.8%, a difference of 1.8%), and Puerto Rican (58.1%, a difference of 2.4%).
| Demographics | Rating | Rank | In Labor Force | Age > 16 |
| Paiute | 0.0 /100 | #333 | Tragic 60.7% |
| Apache | 0.0 /100 | #334 | Tragic 60.7% |
| Natives/Alaskans | 0.0 /100 | #335 | Tragic 60.6% |
| Menominee | 0.0 /100 | #336 | Tragic 60.6% |
| Colville | 0.0 /100 | #337 | Tragic 59.8% |
| Immigrants | Yemen | 0.0 /100 | #338 | Tragic 59.6% |
| Houma | 0.0 /100 | #339 | Tragic 59.5% |
| Pueblo | 0.0 /100 | #340 | Tragic 59.3% |
| Hopi | 0.0 /100 | #341 | Tragic 58.4% |
| Puerto Ricans | 0.0 /100 | #342 | Tragic 58.1% |
| Yuman | 0.0 /100 | #343 | Tragic 57.8% |
| Pima | 0.0 /100 | #344 | Tragic 57.4% |
| Tohono O'odham | 0.0 /100 | #345 | Tragic 57.2% |
| Lumbee | 0.0 /100 | #346 | Tragic 56.8% |
| Navajo | 0.0 /100 | #347 | Tragic 56.6% |