Eastern European vs Lumbee In Labor Force | Age > 16
COMPARE
Eastern European
Lumbee
In Labor Force | Age > 16
In Labor Force | Age > 16 Comparison
Eastern Europeans
Lumbee
65.1%
IN LABOR FORCE | AGE > 16
46.2/ 100
METRIC RATING
177th/ 347
METRIC RANK
56.8%
IN LABOR FORCE | AGE > 16
0.0/ 100
METRIC RATING
346th/ 347
METRIC RANK
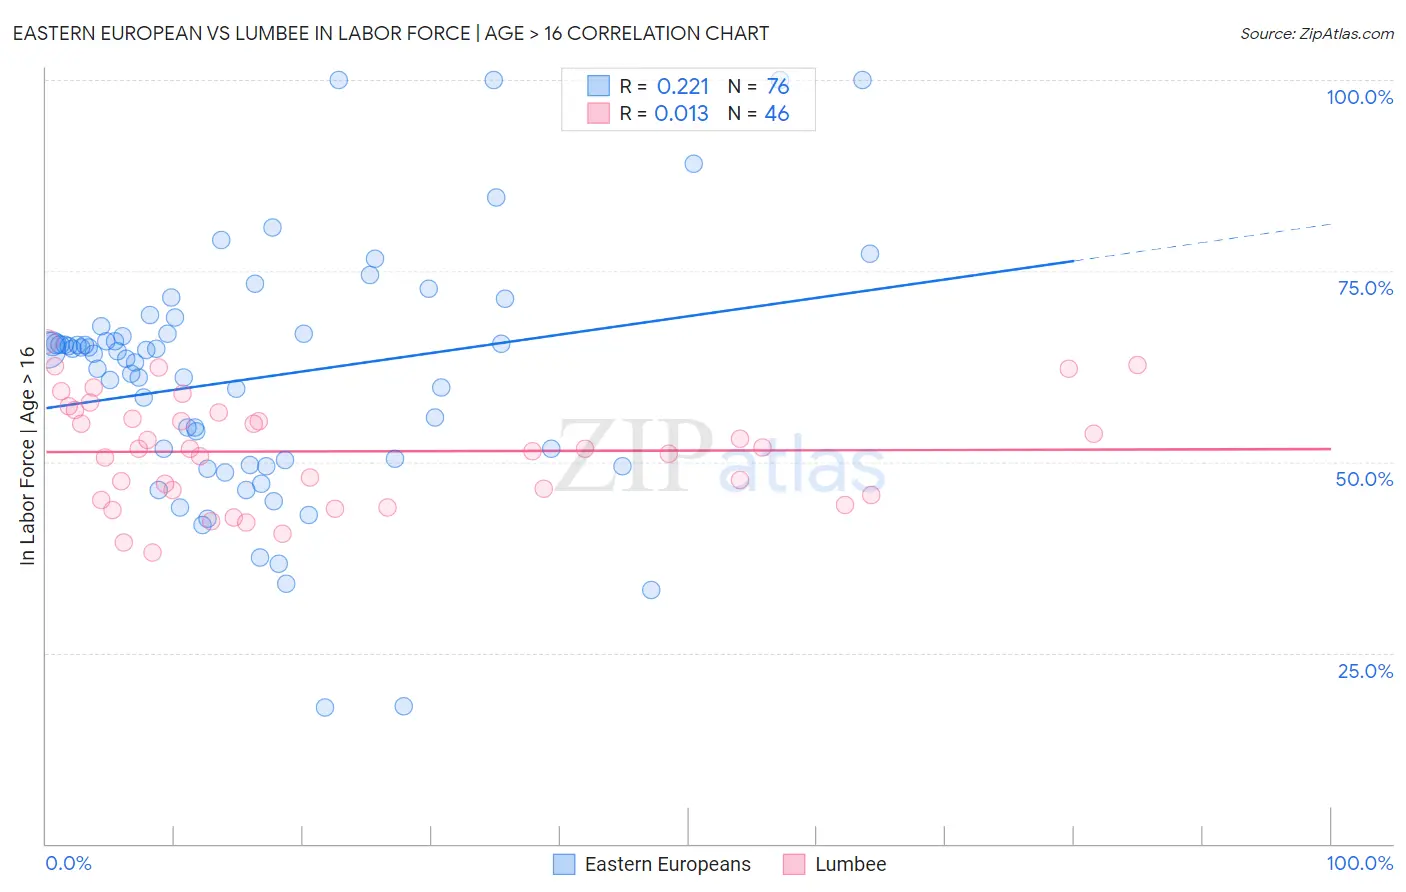
Eastern European vs Lumbee In Labor Force | Age > 16 Correlation Chart
The statistical analysis conducted on geographies consisting of 461,261,446 people shows a weak positive correlation between the proportion of Eastern Europeans and labor force participation rate among population ages 16 and over in the United States with a correlation coefficient (R) of 0.221 and weighted average of 65.1%. Similarly, the statistical analysis conducted on geographies consisting of 92,293,168 people shows no correlation between the proportion of Lumbee and labor force participation rate among population ages 16 and over in the United States with a correlation coefficient (R) of 0.013 and weighted average of 56.8%, a difference of 14.7%.
In Labor Force | Age > 16 Correlation Summary
| Measurement | Eastern European | Lumbee |
| Minimum | 17.9% | 38.2% |
| Maximum | 100.0% | 65.7% |
| Range | 82.1% | 27.5% |
| Mean | 61.1% | 51.4% |
| Median | 64.3% | 51.7% |
| Interquartile 25% (IQ1) | 49.9% | 45.6% |
| Interquartile 75% (IQ3) | 66.8% | 56.4% |
| Interquartile Range (IQR) | 16.9% | 10.8% |
| Standard Deviation (Sample) | 16.2% | 7.0% |
| Standard Deviation (Population) | 16.1% | 6.9% |
Similar Demographics by In Labor Force | Age > 16
Demographics Similar to Eastern Europeans by In Labor Force | Age > 16
In terms of in labor force | age > 16, the demographic groups most similar to Eastern Europeans are Swedish (65.1%, a difference of 0.010%), Trinidadian and Tobagonian (65.1%, a difference of 0.010%), Immigrants from Haiti (65.1%, a difference of 0.030%), Macedonian (65.1%, a difference of 0.040%), and Nicaraguan (65.1%, a difference of 0.040%).
| Demographics | Rating | Rank | In Labor Force | Age > 16 |
| Immigrants | Israel | 61.7 /100 | #170 | Good 65.2% |
| Israelis | 61.6 /100 | #171 | Good 65.2% |
| Immigrants | Sweden | 61.3 /100 | #172 | Good 65.2% |
| Immigrants | Ukraine | 53.7 /100 | #173 | Average 65.1% |
| Macedonians | 50.0 /100 | #174 | Average 65.1% |
| Nicaraguans | 49.7 /100 | #175 | Average 65.1% |
| Swedes | 47.4 /100 | #176 | Average 65.1% |
| Eastern Europeans | 46.2 /100 | #177 | Average 65.1% |
| Trinidadians and Tobagonians | 45.2 /100 | #178 | Average 65.1% |
| Immigrants | Haiti | 43.3 /100 | #179 | Average 65.1% |
| Immigrants | Latvia | 42.9 /100 | #180 | Average 65.1% |
| Immigrants | Panama | 42.4 /100 | #181 | Average 65.1% |
| Immigrants | Nicaragua | 41.1 /100 | #182 | Average 65.1% |
| Soviet Union | 40.5 /100 | #183 | Average 65.0% |
| Carpatho Rusyns | 40.0 /100 | #184 | Average 65.0% |
Demographics Similar to Lumbee by In Labor Force | Age > 16
In terms of in labor force | age > 16, the demographic groups most similar to Lumbee are Navajo (56.6%, a difference of 0.31%), Tohono O'odham (57.2%, a difference of 0.85%), Pima (57.4%, a difference of 1.1%), Yuman (57.8%, a difference of 1.8%), and Puerto Rican (58.1%, a difference of 2.4%).
| Demographics | Rating | Rank | In Labor Force | Age > 16 |
| Paiute | 0.0 /100 | #333 | Tragic 60.7% |
| Apache | 0.0 /100 | #334 | Tragic 60.7% |
| Natives/Alaskans | 0.0 /100 | #335 | Tragic 60.6% |
| Menominee | 0.0 /100 | #336 | Tragic 60.6% |
| Colville | 0.0 /100 | #337 | Tragic 59.8% |
| Immigrants | Yemen | 0.0 /100 | #338 | Tragic 59.6% |
| Houma | 0.0 /100 | #339 | Tragic 59.5% |
| Pueblo | 0.0 /100 | #340 | Tragic 59.3% |
| Hopi | 0.0 /100 | #341 | Tragic 58.4% |
| Puerto Ricans | 0.0 /100 | #342 | Tragic 58.1% |
| Yuman | 0.0 /100 | #343 | Tragic 57.8% |
| Pima | 0.0 /100 | #344 | Tragic 57.4% |
| Tohono O'odham | 0.0 /100 | #345 | Tragic 57.2% |
| Lumbee | 0.0 /100 | #346 | Tragic 56.8% |
| Navajo | 0.0 /100 | #347 | Tragic 56.6% |