Immigrants from Cuba vs Taiwanese In Labor Force | Age > 16
COMPARE
Immigrants from Cuba
Taiwanese
In Labor Force | Age > 16
In Labor Force | Age > 16 Comparison
Immigrants from Cuba
Taiwanese
64.1%
IN LABOR FORCE | AGE > 16
0.3/ 100
METRIC RATING
274th/ 347
METRIC RANK
66.2%
IN LABOR FORCE | AGE > 16
99.7/ 100
METRIC RATING
72nd/ 347
METRIC RANK
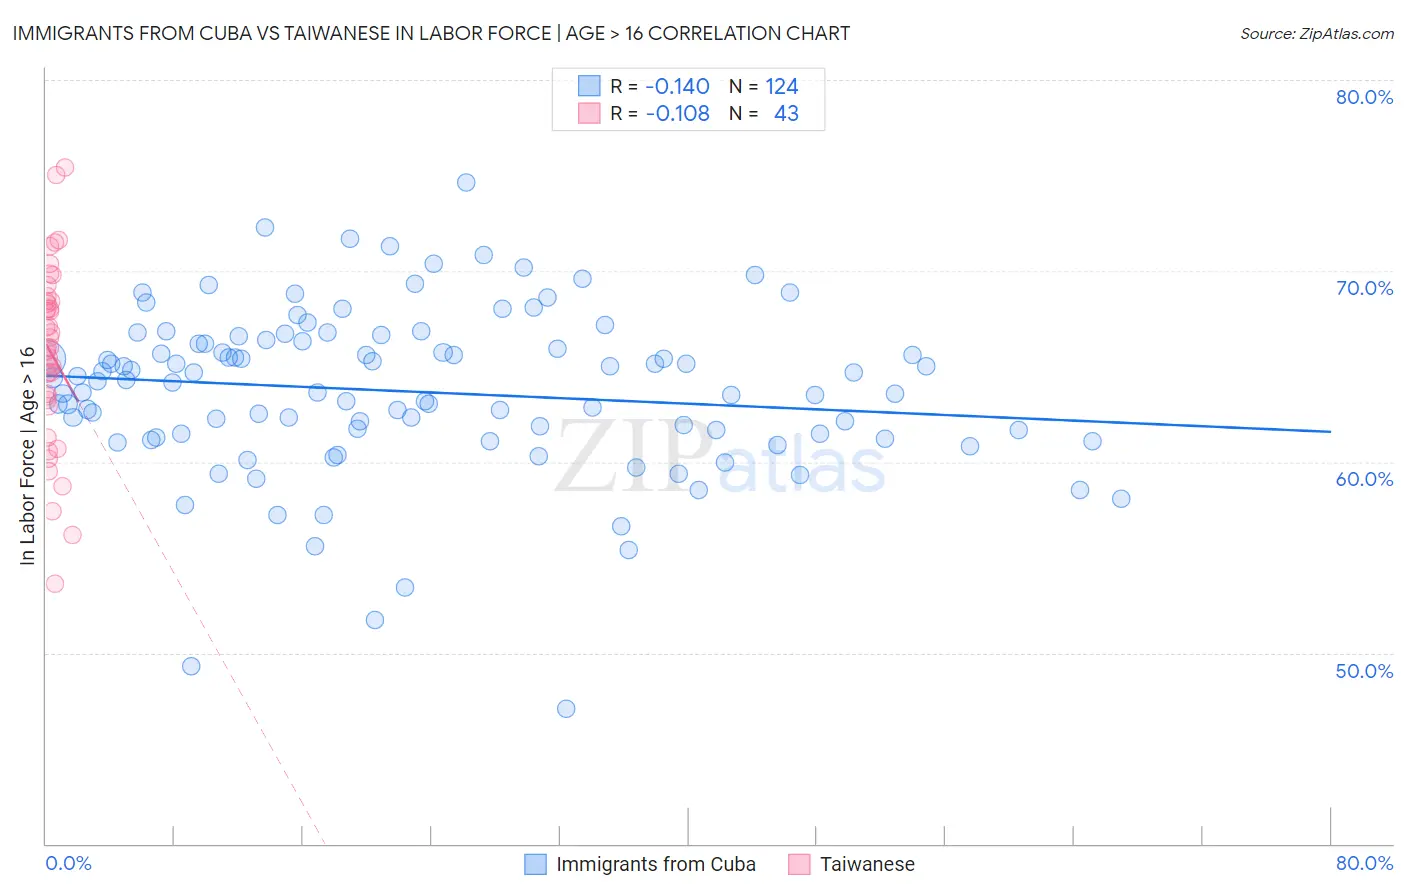
Immigrants from Cuba vs Taiwanese In Labor Force | Age > 16 Correlation Chart
The statistical analysis conducted on geographies consisting of 326,010,342 people shows a poor negative correlation between the proportion of Immigrants from Cuba and labor force participation rate among population ages 16 and over in the United States with a correlation coefficient (R) of -0.140 and weighted average of 64.1%. Similarly, the statistical analysis conducted on geographies consisting of 31,724,466 people shows a poor negative correlation between the proportion of Taiwanese and labor force participation rate among population ages 16 and over in the United States with a correlation coefficient (R) of -0.108 and weighted average of 66.2%, a difference of 3.3%.
In Labor Force | Age > 16 Correlation Summary
| Measurement | Immigrants from Cuba | Taiwanese |
| Minimum | 47.1% | 53.6% |
| Maximum | 74.6% | 75.4% |
| Range | 27.5% | 21.8% |
| Mean | 63.7% | 65.7% |
| Median | 64.2% | 66.0% |
| Interquartile 25% (IQ1) | 61.4% | 63.2% |
| Interquartile 75% (IQ3) | 66.3% | 68.4% |
| Interquartile Range (IQR) | 4.9% | 5.2% |
| Standard Deviation (Sample) | 4.4% | 4.7% |
| Standard Deviation (Population) | 4.4% | 4.6% |
Similar Demographics by In Labor Force | Age > 16
Demographics Similar to Immigrants from Cuba by In Labor Force | Age > 16
In terms of in labor force | age > 16, the demographic groups most similar to Immigrants from Cuba are Mexican (64.1%, a difference of 0.0%), French American Indian (64.1%, a difference of 0.0%), Native Hawaiian (64.1%, a difference of 0.020%), Hmong (64.1%, a difference of 0.020%), and Immigrants from Bahamas (64.0%, a difference of 0.030%).
| Demographics | Rating | Rank | In Labor Force | Age > 16 |
| Canadians | 0.5 /100 | #267 | Tragic 64.1% |
| Spaniards | 0.5 /100 | #268 | Tragic 64.1% |
| Irish | 0.4 /100 | #269 | Tragic 64.1% |
| Guyanese | 0.4 /100 | #270 | Tragic 64.1% |
| Dominicans | 0.4 /100 | #271 | Tragic 64.1% |
| Native Hawaiians | 0.3 /100 | #272 | Tragic 64.1% |
| Hmong | 0.3 /100 | #273 | Tragic 64.1% |
| Immigrants | Cuba | 0.3 /100 | #274 | Tragic 64.1% |
| Mexicans | 0.3 /100 | #275 | Tragic 64.1% |
| French American Indians | 0.3 /100 | #276 | Tragic 64.1% |
| Immigrants | Bahamas | 0.3 /100 | #277 | Tragic 64.0% |
| Assyrians/Chaldeans/Syriacs | 0.3 /100 | #278 | Tragic 64.0% |
| Welsh | 0.2 /100 | #279 | Tragic 64.0% |
| Immigrants | St. Vincent and the Grenadines | 0.2 /100 | #280 | Tragic 64.0% |
| French Canadians | 0.2 /100 | #281 | Tragic 64.0% |
Demographics Similar to Taiwanese by In Labor Force | Age > 16
In terms of in labor force | age > 16, the demographic groups most similar to Taiwanese are Burmese (66.2%, a difference of 0.0%), Immigrants from Vietnam (66.2%, a difference of 0.010%), Immigrants from Korea (66.2%, a difference of 0.010%), Asian (66.2%, a difference of 0.020%), and Immigrants from Singapore (66.2%, a difference of 0.020%).
| Demographics | Rating | Rank | In Labor Force | Age > 16 |
| Sri Lankans | 99.8 /100 | #65 | Exceptional 66.3% |
| Jordanians | 99.8 /100 | #66 | Exceptional 66.3% |
| Egyptians | 99.8 /100 | #67 | Exceptional 66.2% |
| Immigrants | Egypt | 99.7 /100 | #68 | Exceptional 66.2% |
| Sub-Saharan Africans | 99.7 /100 | #69 | Exceptional 66.2% |
| Asians | 99.7 /100 | #70 | Exceptional 66.2% |
| Burmese | 99.7 /100 | #71 | Exceptional 66.2% |
| Taiwanese | 99.7 /100 | #72 | Exceptional 66.2% |
| Immigrants | Vietnam | 99.7 /100 | #73 | Exceptional 66.2% |
| Immigrants | Korea | 99.7 /100 | #74 | Exceptional 66.2% |
| Immigrants | Singapore | 99.7 /100 | #75 | Exceptional 66.2% |
| Immigrants | Malaysia | 99.6 /100 | #76 | Exceptional 66.1% |
| Immigrants | Moldova | 99.6 /100 | #77 | Exceptional 66.1% |
| Immigrants | Asia | 99.6 /100 | #78 | Exceptional 66.1% |
| Turks | 99.6 /100 | #79 | Exceptional 66.1% |