Immigrants from Cuba vs Taiwanese Seniors Poverty Over the Age of 75
COMPARE
Immigrants from Cuba
Taiwanese
Seniors Poverty Over the Age of 75
Seniors Poverty Over the Age of 75 Comparison
Immigrants from Cuba
Taiwanese
19.9%
SENIORS POVERTY OVER THE AGE OF 75
0.0/ 100
METRIC RATING
344th/ 347
METRIC RANK
12.6%
SENIORS POVERTY OVER THE AGE OF 75
17.8/ 100
METRIC RATING
193rd/ 347
METRIC RANK
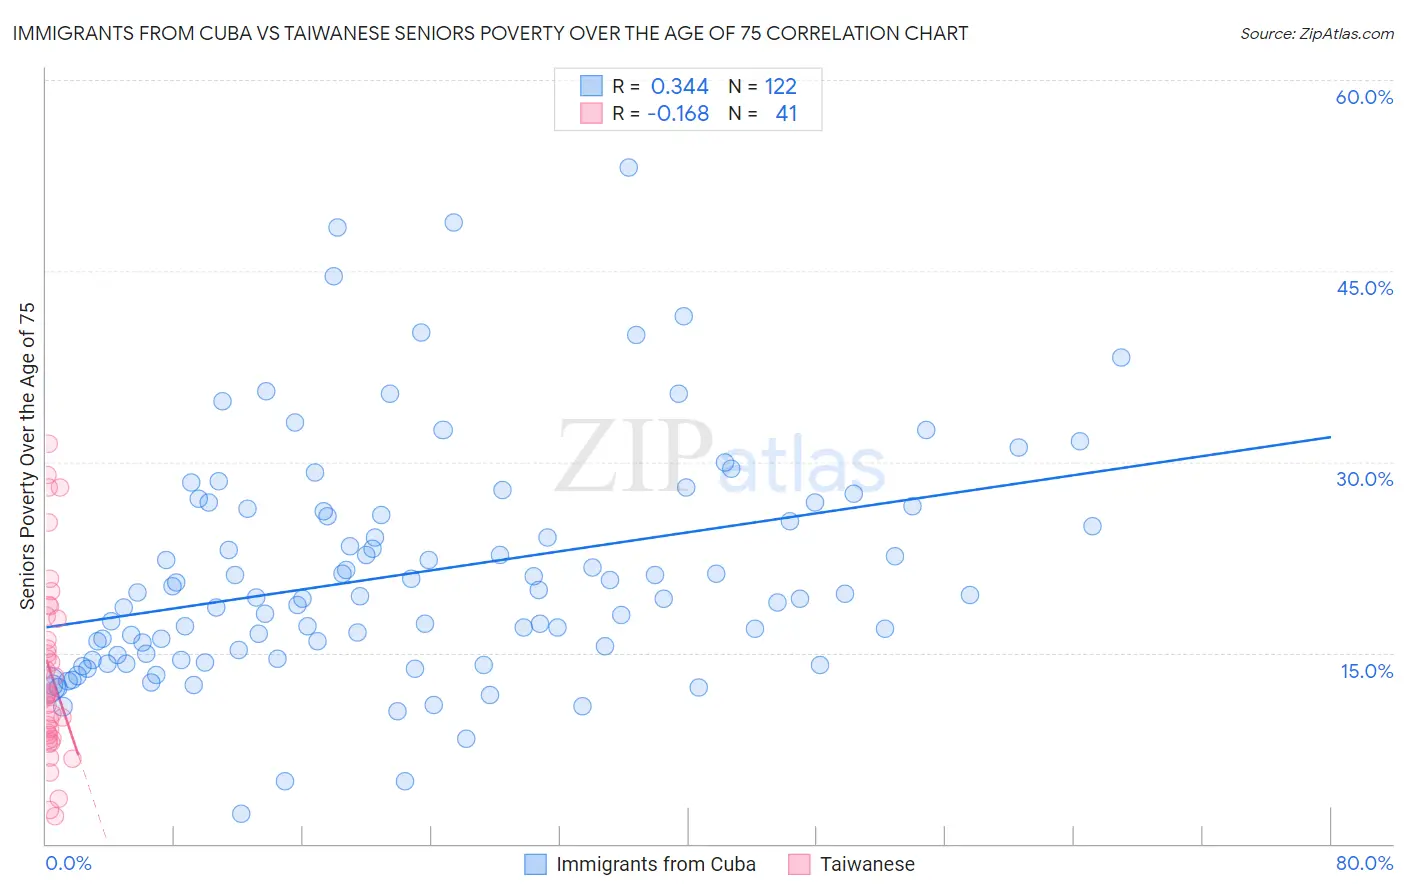
Immigrants from Cuba vs Taiwanese Seniors Poverty Over the Age of 75 Correlation Chart
The statistical analysis conducted on geographies consisting of 323,529,557 people shows a mild positive correlation between the proportion of Immigrants from Cuba and poverty level among seniors over the age of 75 in the United States with a correlation coefficient (R) of 0.344 and weighted average of 19.9%. Similarly, the statistical analysis conducted on geographies consisting of 31,695,905 people shows a poor negative correlation between the proportion of Taiwanese and poverty level among seniors over the age of 75 in the United States with a correlation coefficient (R) of -0.168 and weighted average of 12.6%, a difference of 58.3%.
Seniors Poverty Over the Age of 75 Correlation Summary
| Measurement | Immigrants from Cuba | Taiwanese |
| Minimum | 2.3% | 2.1% |
| Maximum | 53.2% | 31.5% |
| Range | 50.8% | 29.3% |
| Mean | 21.3% | 13.5% |
| Median | 19.4% | 11.7% |
| Interquartile 25% (IQ1) | 14.8% | 8.4% |
| Interquartile 75% (IQ3) | 26.1% | 17.8% |
| Interquartile Range (IQR) | 11.3% | 9.4% |
| Standard Deviation (Sample) | 9.1% | 7.2% |
| Standard Deviation (Population) | 9.1% | 7.1% |
Similar Demographics by Seniors Poverty Over the Age of 75
Demographics Similar to Immigrants from Cuba by Seniors Poverty Over the Age of 75
In terms of seniors poverty over the age of 75, the demographic groups most similar to Immigrants from Cuba are Immigrants from Dominican Republic (20.1%, a difference of 0.78%), Lumbee (19.7%, a difference of 0.79%), Dominican (19.6%, a difference of 1.5%), Navajo (19.4%, a difference of 2.7%), and Tohono O'odham (19.1%, a difference of 4.0%).
| Demographics | Rating | Rank | Seniors Poverty Over the Age of 75 |
| Immigrants | Nicaragua | 0.0 /100 | #333 | Tragic 17.6% |
| Immigrants | Grenada | 0.0 /100 | #334 | Tragic 17.8% |
| Cubans | 0.0 /100 | #335 | Tragic 18.0% |
| Immigrants | Caribbean | 0.0 /100 | #336 | Tragic 18.2% |
| Yakama | 0.0 /100 | #337 | Tragic 18.3% |
| Immigrants | Cabo Verde | 0.0 /100 | #338 | Tragic 18.5% |
| Hopi | 0.0 /100 | #339 | Tragic 18.9% |
| Tohono O'odham | 0.0 /100 | #340 | Tragic 19.1% |
| Navajo | 0.0 /100 | #341 | Tragic 19.4% |
| Dominicans | 0.0 /100 | #342 | Tragic 19.6% |
| Lumbee | 0.0 /100 | #343 | Tragic 19.7% |
| Immigrants | Cuba | 0.0 /100 | #344 | Tragic 19.9% |
| Immigrants | Dominican Republic | 0.0 /100 | #345 | Tragic 20.1% |
| Puerto Ricans | 0.0 /100 | #346 | Tragic 23.2% |
| Pima | 0.0 /100 | #347 | Tragic 23.9% |
Demographics Similar to Taiwanese by Seniors Poverty Over the Age of 75
In terms of seniors poverty over the age of 75, the demographic groups most similar to Taiwanese are Alsatian (12.6%, a difference of 0.010%), Immigrants from France (12.6%, a difference of 0.060%), Immigrants from Eastern Europe (12.6%, a difference of 0.24%), Choctaw (12.5%, a difference of 0.31%), and Nepalese (12.6%, a difference of 0.50%).
| Demographics | Rating | Rank | Seniors Poverty Over the Age of 75 |
| Sri Lankans | 32.3 /100 | #186 | Fair 12.4% |
| Yaqui | 25.9 /100 | #187 | Fair 12.5% |
| Immigrants | Northern Africa | 25.2 /100 | #188 | Fair 12.5% |
| Immigrants | Indonesia | 24.4 /100 | #189 | Fair 12.5% |
| Immigrants | Congo | 23.9 /100 | #190 | Fair 12.5% |
| Liberians | 23.2 /100 | #191 | Fair 12.5% |
| Choctaw | 20.2 /100 | #192 | Fair 12.5% |
| Taiwanese | 17.8 /100 | #193 | Poor 12.6% |
| Alsatians | 17.7 /100 | #194 | Poor 12.6% |
| Immigrants | France | 17.4 /100 | #195 | Poor 12.6% |
| Immigrants | Eastern Europe | 16.0 /100 | #196 | Poor 12.6% |
| Nepalese | 14.4 /100 | #197 | Poor 12.6% |
| Chileans | 13.7 /100 | #198 | Poor 12.6% |
| Immigrants | Lebanon | 12.7 /100 | #199 | Poor 12.7% |
| Immigrants | Vietnam | 12.1 /100 | #200 | Poor 12.7% |