Immigrants from Cuba vs Immigrants from Chile In Labor Force | Age > 16
COMPARE
Immigrants from Cuba
Immigrants from Chile
In Labor Force | Age > 16
In Labor Force | Age > 16 Comparison
Immigrants from Cuba
Immigrants from Chile
64.1%
IN LABOR FORCE | AGE > 16
0.3/ 100
METRIC RATING
274th/ 347
METRIC RANK
65.9%
IN LABOR FORCE | AGE > 16
98.7/ 100
METRIC RATING
98th/ 347
METRIC RANK
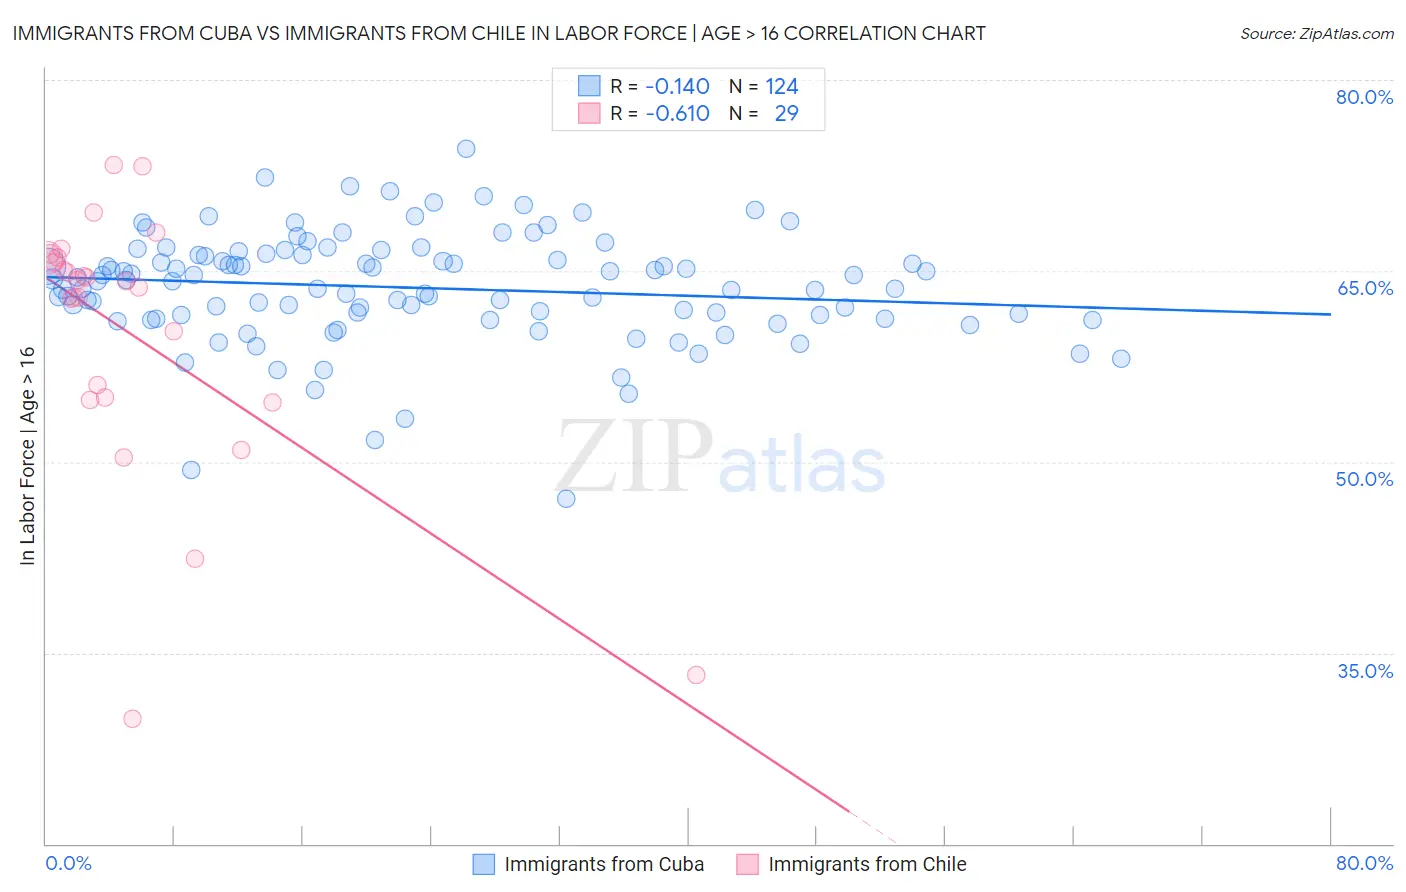
Immigrants from Cuba vs Immigrants from Chile In Labor Force | Age > 16 Correlation Chart
The statistical analysis conducted on geographies consisting of 326,010,342 people shows a poor negative correlation between the proportion of Immigrants from Cuba and labor force participation rate among population ages 16 and over in the United States with a correlation coefficient (R) of -0.140 and weighted average of 64.1%. Similarly, the statistical analysis conducted on geographies consisting of 218,647,266 people shows a significant negative correlation between the proportion of Immigrants from Chile and labor force participation rate among population ages 16 and over in the United States with a correlation coefficient (R) of -0.610 and weighted average of 65.9%, a difference of 2.9%.
In Labor Force | Age > 16 Correlation Summary
| Measurement | Immigrants from Cuba | Immigrants from Chile |
| Minimum | 47.1% | 29.8% |
| Maximum | 74.6% | 73.3% |
| Range | 27.5% | 43.5% |
| Mean | 63.7% | 60.1% |
| Median | 64.2% | 64.2% |
| Interquartile 25% (IQ1) | 61.4% | 55.0% |
| Interquartile 75% (IQ3) | 66.3% | 66.1% |
| Interquartile Range (IQR) | 4.9% | 11.1% |
| Standard Deviation (Sample) | 4.4% | 10.5% |
| Standard Deviation (Population) | 4.4% | 10.3% |
Similar Demographics by In Labor Force | Age > 16
Demographics Similar to Immigrants from Cuba by In Labor Force | Age > 16
In terms of in labor force | age > 16, the demographic groups most similar to Immigrants from Cuba are Mexican (64.1%, a difference of 0.0%), French American Indian (64.1%, a difference of 0.0%), Native Hawaiian (64.1%, a difference of 0.020%), Hmong (64.1%, a difference of 0.020%), and Immigrants from Bahamas (64.0%, a difference of 0.030%).
| Demographics | Rating | Rank | In Labor Force | Age > 16 |
| Canadians | 0.5 /100 | #267 | Tragic 64.1% |
| Spaniards | 0.5 /100 | #268 | Tragic 64.1% |
| Irish | 0.4 /100 | #269 | Tragic 64.1% |
| Guyanese | 0.4 /100 | #270 | Tragic 64.1% |
| Dominicans | 0.4 /100 | #271 | Tragic 64.1% |
| Native Hawaiians | 0.3 /100 | #272 | Tragic 64.1% |
| Hmong | 0.3 /100 | #273 | Tragic 64.1% |
| Immigrants | Cuba | 0.3 /100 | #274 | Tragic 64.1% |
| Mexicans | 0.3 /100 | #275 | Tragic 64.1% |
| French American Indians | 0.3 /100 | #276 | Tragic 64.1% |
| Immigrants | Bahamas | 0.3 /100 | #277 | Tragic 64.0% |
| Assyrians/Chaldeans/Syriacs | 0.3 /100 | #278 | Tragic 64.0% |
| Welsh | 0.2 /100 | #279 | Tragic 64.0% |
| Immigrants | St. Vincent and the Grenadines | 0.2 /100 | #280 | Tragic 64.0% |
| French Canadians | 0.2 /100 | #281 | Tragic 64.0% |
Demographics Similar to Immigrants from Chile by In Labor Force | Age > 16
In terms of in labor force | age > 16, the demographic groups most similar to Immigrants from Chile are Immigrants from Australia (65.9%, a difference of 0.010%), Okinawan (65.9%, a difference of 0.020%), Immigrants from Colombia (65.9%, a difference of 0.020%), Uruguayan (65.9%, a difference of 0.020%), and Filipino (65.9%, a difference of 0.030%).
| Demographics | Rating | Rank | In Labor Force | Age > 16 |
| Iranians | 99.2 /100 | #91 | Exceptional 66.0% |
| Aleuts | 99.1 /100 | #92 | Exceptional 66.0% |
| Immigrants | South America | 99.1 /100 | #93 | Exceptional 66.0% |
| Immigrants | Cambodia | 99.1 /100 | #94 | Exceptional 66.0% |
| Immigrants | Uruguay | 99.1 /100 | #95 | Exceptional 66.0% |
| Bangladeshis | 98.9 /100 | #96 | Exceptional 65.9% |
| Filipinos | 98.9 /100 | #97 | Exceptional 65.9% |
| Immigrants | Chile | 98.7 /100 | #98 | Exceptional 65.9% |
| Immigrants | Australia | 98.7 /100 | #99 | Exceptional 65.9% |
| Okinawans | 98.7 /100 | #100 | Exceptional 65.9% |
| Immigrants | Colombia | 98.6 /100 | #101 | Exceptional 65.9% |
| Uruguayans | 98.6 /100 | #102 | Exceptional 65.9% |
| Immigrants | South Eastern Asia | 98.5 /100 | #103 | Exceptional 65.9% |
| Palestinians | 98.5 /100 | #104 | Exceptional 65.9% |
| Colombians | 98.4 /100 | #105 | Exceptional 65.9% |