Immigrants from Cuba vs Immigrants from Central America In Labor Force | Age 30-34
COMPARE
Immigrants from Cuba
Immigrants from Central America
In Labor Force | Age 30-34
In Labor Force | Age 30-34 Comparison
Immigrants from Cuba
Immigrants from Central America
84.2%
IN LABOR FORCE | AGE 30-34
3.0/ 100
METRIC RATING
227th/ 347
METRIC RANK
82.5%
IN LABOR FORCE | AGE 30-34
0.0/ 100
METRIC RATING
299th/ 347
METRIC RANK
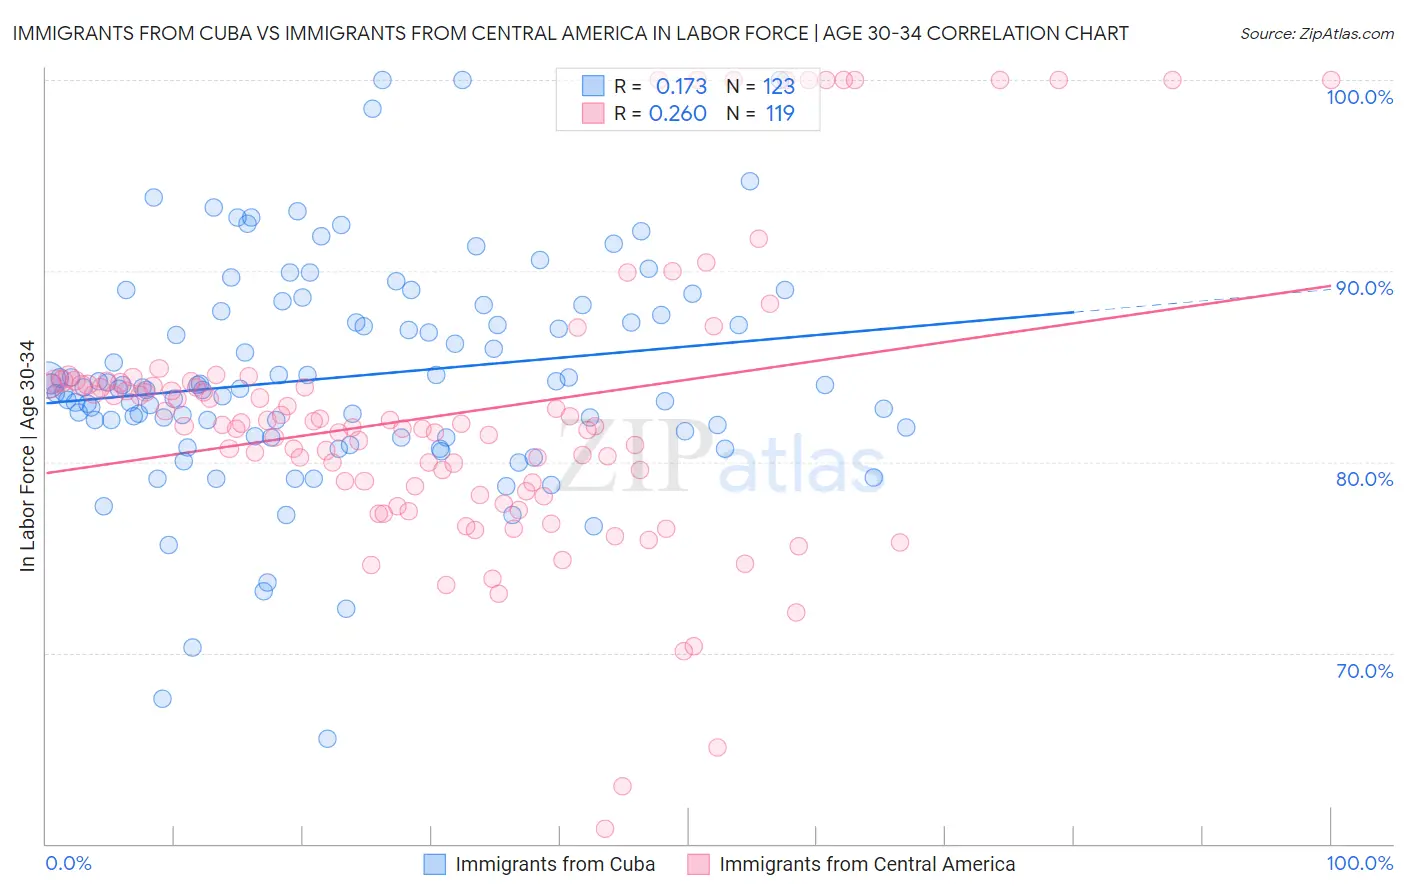
Immigrants from Cuba vs Immigrants from Central America In Labor Force | Age 30-34 Correlation Chart
The statistical analysis conducted on geographies consisting of 325,881,982 people shows a poor positive correlation between the proportion of Immigrants from Cuba and labor force participation rate among population between the ages 30 and 34 in the United States with a correlation coefficient (R) of 0.173 and weighted average of 84.2%. Similarly, the statistical analysis conducted on geographies consisting of 535,746,128 people shows a weak positive correlation between the proportion of Immigrants from Central America and labor force participation rate among population between the ages 30 and 34 in the United States with a correlation coefficient (R) of 0.260 and weighted average of 82.5%, a difference of 2.1%.
In Labor Force | Age 30-34 Correlation Summary
| Measurement | Immigrants from Cuba | Immigrants from Central America |
| Minimum | 65.5% | 60.8% |
| Maximum | 100.0% | 100.0% |
| Range | 34.5% | 39.2% |
| Mean | 84.5% | 82.5% |
| Median | 83.9% | 81.9% |
| Interquartile 25% (IQ1) | 81.4% | 78.4% |
| Interquartile 75% (IQ3) | 87.9% | 84.1% |
| Interquartile Range (IQR) | 6.5% | 5.7% |
| Standard Deviation (Sample) | 5.8% | 7.6% |
| Standard Deviation (Population) | 5.8% | 7.5% |
Similar Demographics by In Labor Force | Age 30-34
Demographics Similar to Immigrants from Cuba by In Labor Force | Age 30-34
In terms of in labor force | age 30-34, the demographic groups most similar to Immigrants from Cuba are Immigrants from El Salvador (84.2%, a difference of 0.0%), Scottish (84.2%, a difference of 0.010%), Immigrants from Haiti (84.2%, a difference of 0.010%), Welsh (84.2%, a difference of 0.010%), and Cuban (84.2%, a difference of 0.020%).
| Demographics | Rating | Rank | In Labor Force | Age 30-34 |
| Danes | 5.3 /100 | #220 | Tragic 84.3% |
| Salvadorans | 3.8 /100 | #221 | Tragic 84.2% |
| Panamanians | 3.8 /100 | #222 | Tragic 84.2% |
| Immigrants | Laos | 3.6 /100 | #223 | Tragic 84.2% |
| Cubans | 3.4 /100 | #224 | Tragic 84.2% |
| Scottish | 3.1 /100 | #225 | Tragic 84.2% |
| Immigrants | El Salvador | 3.0 /100 | #226 | Tragic 84.2% |
| Immigrants | Cuba | 3.0 /100 | #227 | Tragic 84.2% |
| Immigrants | Haiti | 2.8 /100 | #228 | Tragic 84.2% |
| Welsh | 2.7 /100 | #229 | Tragic 84.2% |
| Immigrants | Bahamas | 2.6 /100 | #230 | Tragic 84.1% |
| Malaysians | 2.2 /100 | #231 | Tragic 84.1% |
| Immigrants | Immigrants | 2.0 /100 | #232 | Tragic 84.1% |
| West Indians | 1.9 /100 | #233 | Tragic 84.1% |
| Haitians | 1.8 /100 | #234 | Tragic 84.1% |
Demographics Similar to Immigrants from Central America by In Labor Force | Age 30-34
In terms of in labor force | age 30-34, the demographic groups most similar to Immigrants from Central America are Hmong (82.4%, a difference of 0.060%), Hispanic or Latino (82.4%, a difference of 0.070%), Ottawa (82.4%, a difference of 0.10%), Immigrants from Micronesia (82.4%, a difference of 0.11%), and Comanche (82.6%, a difference of 0.13%).
| Demographics | Rating | Rank | In Labor Force | Age 30-34 |
| Blacks/African Americans | 0.0 /100 | #292 | Tragic 82.8% |
| Nepalese | 0.0 /100 | #293 | Tragic 82.7% |
| Americans | 0.0 /100 | #294 | Tragic 82.7% |
| Pennsylvania Germans | 0.0 /100 | #295 | Tragic 82.6% |
| Chippewa | 0.0 /100 | #296 | Tragic 82.6% |
| Comanche | 0.0 /100 | #297 | Tragic 82.6% |
| Aleuts | 0.0 /100 | #298 | Tragic 82.6% |
| Immigrants | Central America | 0.0 /100 | #299 | Tragic 82.5% |
| Hmong | 0.0 /100 | #300 | Tragic 82.4% |
| Hispanics or Latinos | 0.0 /100 | #301 | Tragic 82.4% |
| Ottawa | 0.0 /100 | #302 | Tragic 82.4% |
| Immigrants | Micronesia | 0.0 /100 | #303 | Tragic 82.4% |
| Tlingit-Haida | 0.0 /100 | #304 | Tragic 82.3% |
| Osage | 0.0 /100 | #305 | Tragic 82.3% |
| Spanish American Indians | 0.0 /100 | #306 | Tragic 82.2% |