Immigrants from Cuba vs Cree In Labor Force | Age 30-34
COMPARE
Immigrants from Cuba
Cree
In Labor Force | Age 30-34
In Labor Force | Age 30-34 Comparison
Immigrants from Cuba
Cree
84.2%
IN LABOR FORCE | AGE 30-34
3.0/ 100
METRIC RATING
227th/ 347
METRIC RANK
83.2%
IN LABOR FORCE | AGE 30-34
0.0/ 100
METRIC RATING
285th/ 347
METRIC RANK
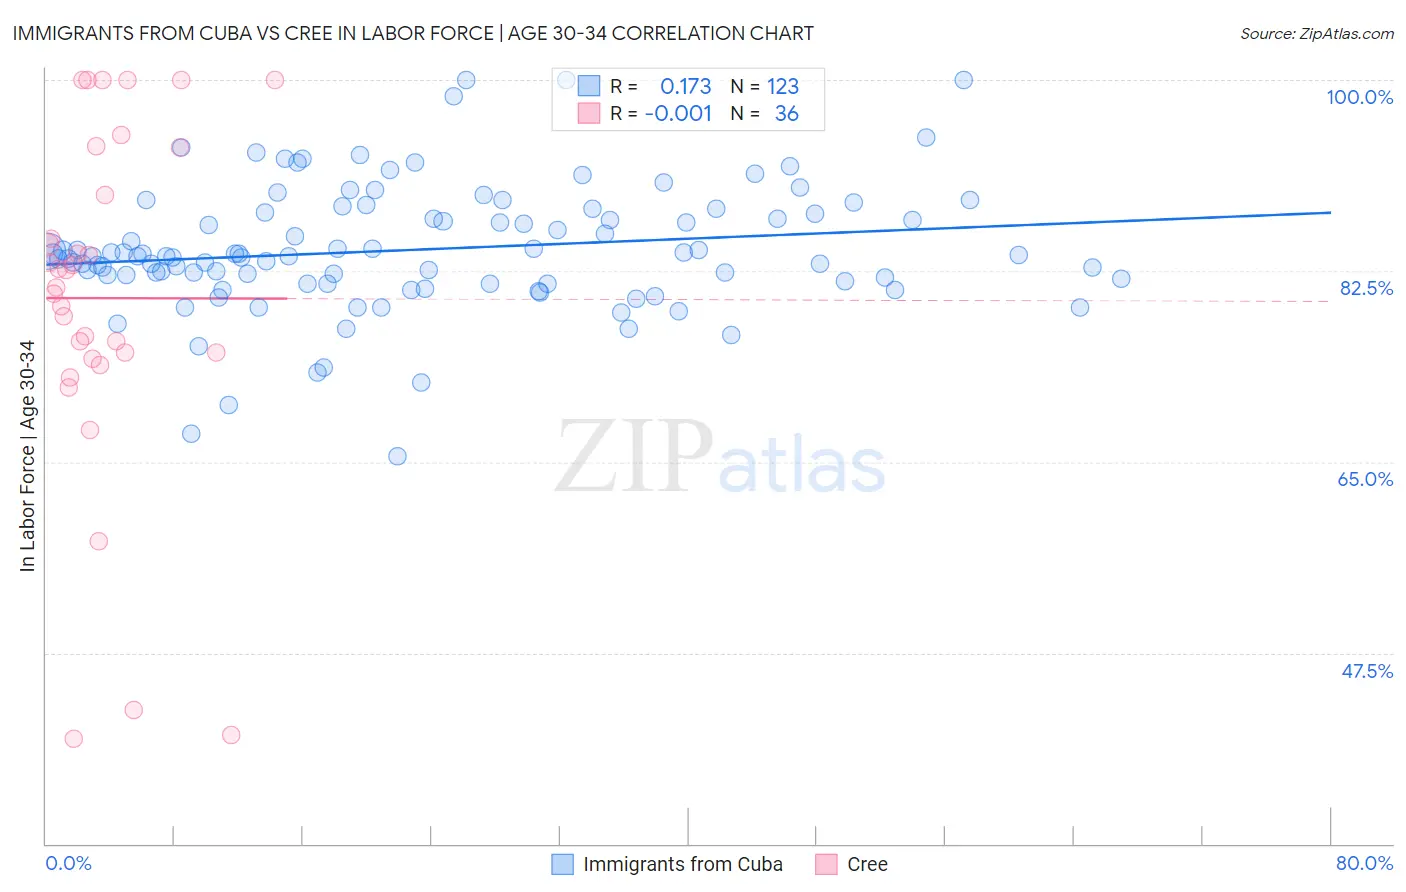
Immigrants from Cuba vs Cree In Labor Force | Age 30-34 Correlation Chart
The statistical analysis conducted on geographies consisting of 325,881,982 people shows a poor positive correlation between the proportion of Immigrants from Cuba and labor force participation rate among population between the ages 30 and 34 in the United States with a correlation coefficient (R) of 0.173 and weighted average of 84.2%. Similarly, the statistical analysis conducted on geographies consisting of 76,199,650 people shows no correlation between the proportion of Cree and labor force participation rate among population between the ages 30 and 34 in the United States with a correlation coefficient (R) of -0.001 and weighted average of 83.2%, a difference of 1.2%.
In Labor Force | Age 30-34 Correlation Summary
| Measurement | Immigrants from Cuba | Cree |
| Minimum | 65.5% | 39.6% |
| Maximum | 100.0% | 100.0% |
| Range | 34.5% | 60.4% |
| Mean | 84.5% | 80.0% |
| Median | 83.9% | 81.8% |
| Interquartile 25% (IQ1) | 81.4% | 74.7% |
| Interquartile 75% (IQ3) | 87.9% | 91.7% |
| Interquartile Range (IQR) | 6.5% | 17.0% |
| Standard Deviation (Sample) | 5.8% | 15.9% |
| Standard Deviation (Population) | 5.8% | 15.6% |
Similar Demographics by In Labor Force | Age 30-34
Demographics Similar to Immigrants from Cuba by In Labor Force | Age 30-34
In terms of in labor force | age 30-34, the demographic groups most similar to Immigrants from Cuba are Immigrants from El Salvador (84.2%, a difference of 0.0%), Scottish (84.2%, a difference of 0.010%), Immigrants from Haiti (84.2%, a difference of 0.010%), Welsh (84.2%, a difference of 0.010%), and Cuban (84.2%, a difference of 0.020%).
| Demographics | Rating | Rank | In Labor Force | Age 30-34 |
| Danes | 5.3 /100 | #220 | Tragic 84.3% |
| Salvadorans | 3.8 /100 | #221 | Tragic 84.2% |
| Panamanians | 3.8 /100 | #222 | Tragic 84.2% |
| Immigrants | Laos | 3.6 /100 | #223 | Tragic 84.2% |
| Cubans | 3.4 /100 | #224 | Tragic 84.2% |
| Scottish | 3.1 /100 | #225 | Tragic 84.2% |
| Immigrants | El Salvador | 3.0 /100 | #226 | Tragic 84.2% |
| Immigrants | Cuba | 3.0 /100 | #227 | Tragic 84.2% |
| Immigrants | Haiti | 2.8 /100 | #228 | Tragic 84.2% |
| Welsh | 2.7 /100 | #229 | Tragic 84.2% |
| Immigrants | Bahamas | 2.6 /100 | #230 | Tragic 84.1% |
| Malaysians | 2.2 /100 | #231 | Tragic 84.1% |
| Immigrants | Immigrants | 2.0 /100 | #232 | Tragic 84.1% |
| West Indians | 1.9 /100 | #233 | Tragic 84.1% |
| Haitians | 1.8 /100 | #234 | Tragic 84.1% |
Demographics Similar to Cree by In Labor Force | Age 30-34
In terms of in labor force | age 30-34, the demographic groups most similar to Cree are Immigrants from Belize (83.2%, a difference of 0.0%), Assyrian/Chaldean/Syriac (83.2%, a difference of 0.050%), Immigrants from Latin America (83.1%, a difference of 0.060%), Mexican American Indian (83.2%, a difference of 0.070%), and Samoan (83.3%, a difference of 0.10%).
| Demographics | Rating | Rank | In Labor Force | Age 30-34 |
| Fijians | 0.0 /100 | #278 | Tragic 83.4% |
| Immigrants | Fiji | 0.0 /100 | #279 | Tragic 83.4% |
| Africans | 0.0 /100 | #280 | Tragic 83.4% |
| Samoans | 0.0 /100 | #281 | Tragic 83.3% |
| Mexican American Indians | 0.0 /100 | #282 | Tragic 83.2% |
| Assyrians/Chaldeans/Syriacs | 0.0 /100 | #283 | Tragic 83.2% |
| Immigrants | Belize | 0.0 /100 | #284 | Tragic 83.2% |
| Cree | 0.0 /100 | #285 | Tragic 83.2% |
| Immigrants | Latin America | 0.0 /100 | #286 | Tragic 83.1% |
| Native Hawaiians | 0.0 /100 | #287 | Tragic 83.0% |
| Central American Indians | 0.0 /100 | #288 | Tragic 83.0% |
| Hawaiians | 0.0 /100 | #289 | Tragic 83.0% |
| Blackfeet | 0.0 /100 | #290 | Tragic 82.8% |
| Potawatomi | 0.0 /100 | #291 | Tragic 82.8% |
| Blacks/African Americans | 0.0 /100 | #292 | Tragic 82.8% |