Immigrants from Croatia vs Bulgarian In Labor Force | Age 16-19
COMPARE
Immigrants from Croatia
Bulgarian
In Labor Force | Age 16-19
In Labor Force | Age 16-19 Comparison
Immigrants from Croatia
Bulgarians
36.1%
IN LABOR FORCE | AGE 16-19
27.5/ 100
METRIC RATING
191st/ 347
METRIC RANK
38.3%
IN LABOR FORCE | AGE 16-19
97.9/ 100
METRIC RATING
115th/ 347
METRIC RANK
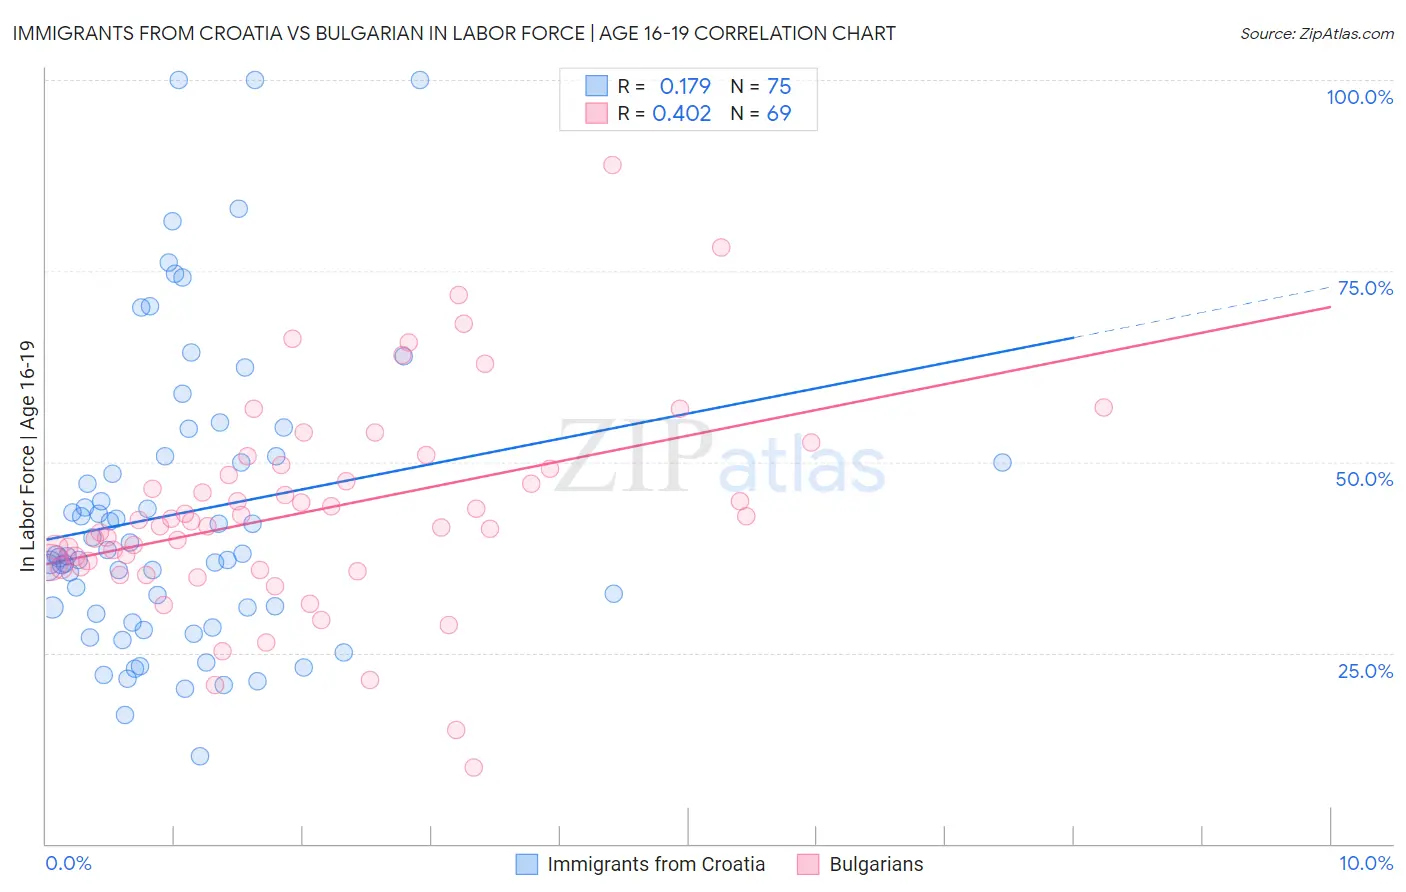
Immigrants from Croatia vs Bulgarian In Labor Force | Age 16-19 Correlation Chart
The statistical analysis conducted on geographies consisting of 132,497,839 people shows a poor positive correlation between the proportion of Immigrants from Croatia and labor force participation rate among population between the ages 16 and 19 in the United States with a correlation coefficient (R) of 0.179 and weighted average of 36.1%. Similarly, the statistical analysis conducted on geographies consisting of 205,432,687 people shows a moderate positive correlation between the proportion of Bulgarians and labor force participation rate among population between the ages 16 and 19 in the United States with a correlation coefficient (R) of 0.402 and weighted average of 38.3%, a difference of 6.2%.
In Labor Force | Age 16-19 Correlation Summary
| Measurement | Immigrants from Croatia | Bulgarian |
| Minimum | 11.5% | 10.0% |
| Maximum | 100.0% | 88.9% |
| Range | 88.5% | 78.9% |
| Mean | 43.3% | 43.6% |
| Median | 37.8% | 42.3% |
| Interquartile 25% (IQ1) | 30.1% | 36.2% |
| Interquartile 75% (IQ3) | 50.7% | 49.3% |
| Interquartile Range (IQR) | 20.6% | 13.1% |
| Standard Deviation (Sample) | 19.6% | 13.7% |
| Standard Deviation (Population) | 19.5% | 13.6% |
Similar Demographics by In Labor Force | Age 16-19
Demographics Similar to Immigrants from Croatia by In Labor Force | Age 16-19
In terms of in labor force | age 16-19, the demographic groups most similar to Immigrants from Croatia are Panamanian (36.1%, a difference of 0.070%), Immigrants from Hungary (36.2%, a difference of 0.080%), Afghan (36.1%, a difference of 0.12%), Immigrants from Denmark (36.1%, a difference of 0.17%), and Nigerian (36.1%, a difference of 0.19%).
| Demographics | Rating | Rank | In Labor Force | Age 16-19 |
| Costa Ricans | 36.1 /100 | #184 | Fair 36.3% |
| Bhutanese | 35.3 /100 | #185 | Fair 36.3% |
| Immigrants | Romania | 34.0 /100 | #186 | Fair 36.3% |
| Immigrants | Afghanistan | 34.0 /100 | #187 | Fair 36.3% |
| Immigrants | Europe | 31.8 /100 | #188 | Fair 36.2% |
| Immigrants | Hungary | 28.8 /100 | #189 | Fair 36.2% |
| Panamanians | 28.6 /100 | #190 | Fair 36.1% |
| Immigrants | Croatia | 27.5 /100 | #191 | Fair 36.1% |
| Afghans | 25.7 /100 | #192 | Fair 36.1% |
| Immigrants | Denmark | 25.0 /100 | #193 | Fair 36.1% |
| Nigerians | 24.6 /100 | #194 | Fair 36.1% |
| Bolivians | 23.3 /100 | #195 | Fair 36.0% |
| Mexican American Indians | 21.1 /100 | #196 | Fair 36.0% |
| Immigrants | Serbia | 21.0 /100 | #197 | Fair 36.0% |
| Immigrants | Northern Africa | 19.9 /100 | #198 | Poor 35.9% |
Demographics Similar to Bulgarians by In Labor Force | Age 16-19
In terms of in labor force | age 16-19, the demographic groups most similar to Bulgarians are Colville (38.3%, a difference of 0.010%), Chickasaw (38.3%, a difference of 0.060%), Immigrants from Nepal (38.3%, a difference of 0.070%), Assyrian/Chaldean/Syriac (38.3%, a difference of 0.080%), and Hawaiian (38.4%, a difference of 0.15%).
| Demographics | Rating | Rank | In Labor Force | Age 16-19 |
| Immigrants | Ethiopia | 98.7 /100 | #108 | Exceptional 38.6% |
| Lebanese | 98.7 /100 | #109 | Exceptional 38.6% |
| Maltese | 98.6 /100 | #110 | Exceptional 38.5% |
| Crow | 98.5 /100 | #111 | Exceptional 38.5% |
| Immigrants | Scotland | 98.5 /100 | #112 | Exceptional 38.5% |
| Sub-Saharan Africans | 98.3 /100 | #113 | Exceptional 38.4% |
| Hawaiians | 98.2 /100 | #114 | Exceptional 38.4% |
| Bulgarians | 97.9 /100 | #115 | Exceptional 38.3% |
| Colville | 97.9 /100 | #116 | Exceptional 38.3% |
| Chickasaw | 97.8 /100 | #117 | Exceptional 38.3% |
| Immigrants | Nepal | 97.8 /100 | #118 | Exceptional 38.3% |
| Assyrians/Chaldeans/Syriacs | 97.8 /100 | #119 | Exceptional 38.3% |
| Ukrainians | 97.6 /100 | #120 | Exceptional 38.3% |
| Ethiopians | 97.4 /100 | #121 | Exceptional 38.2% |
| Guamanians/Chamorros | 97.4 /100 | #122 | Exceptional 38.2% |