Moroccan vs Immigrants from Sweden In Labor Force | Age 20-24
COMPARE
Moroccan
Immigrants from Sweden
In Labor Force | Age 20-24
In Labor Force | Age 20-24 Comparison
Moroccans
Immigrants from Sweden
74.7%
IN LABOR FORCE | AGE 20-24
20.4/ 100
METRIC RATING
202nd/ 347
METRIC RANK
74.2%
IN LABOR FORCE | AGE 20-24
4.6/ 100
METRIC RATING
229th/ 347
METRIC RANK
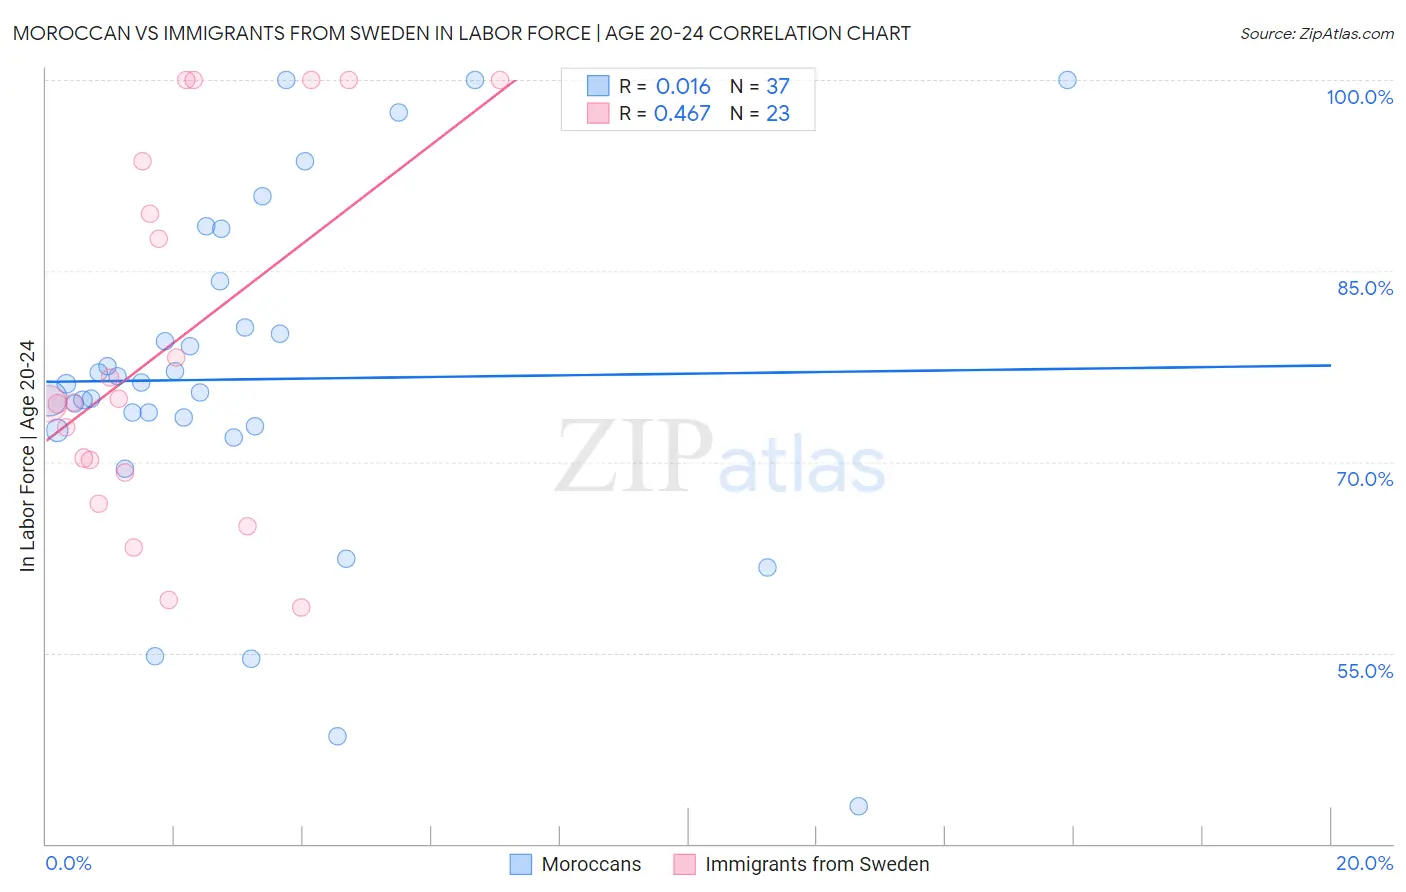
Moroccan vs Immigrants from Sweden In Labor Force | Age 20-24 Correlation Chart
The statistical analysis conducted on geographies consisting of 201,764,515 people shows no correlation between the proportion of Moroccans and labor force participation rate among population between the ages 20 and 24 in the United States with a correlation coefficient (R) of 0.016 and weighted average of 74.7%. Similarly, the statistical analysis conducted on geographies consisting of 164,691,562 people shows a moderate positive correlation between the proportion of Immigrants from Sweden and labor force participation rate among population between the ages 20 and 24 in the United States with a correlation coefficient (R) of 0.467 and weighted average of 74.2%, a difference of 0.62%.
In Labor Force | Age 20-24 Correlation Summary
| Measurement | Moroccan | Immigrants from Sweden |
| Minimum | 42.9% | 58.6% |
| Maximum | 100.0% | 100.0% |
| Range | 57.1% | 41.4% |
| Mean | 76.5% | 79.1% |
| Median | 76.1% | 74.7% |
| Interquartile 25% (IQ1) | 72.6% | 69.2% |
| Interquartile 75% (IQ3) | 82.4% | 93.6% |
| Interquartile Range (IQR) | 9.8% | 24.4% |
| Standard Deviation (Sample) | 13.3% | 14.1% |
| Standard Deviation (Population) | 13.2% | 13.8% |
Similar Demographics by In Labor Force | Age 20-24
Demographics Similar to Moroccans by In Labor Force | Age 20-24
In terms of in labor force | age 20-24, the demographic groups most similar to Moroccans are Choctaw (74.7%, a difference of 0.020%), Nigerian (74.7%, a difference of 0.030%), Taiwanese (74.7%, a difference of 0.060%), Immigrants from Northern Africa (74.6%, a difference of 0.060%), and Immigrants from Italy (74.6%, a difference of 0.070%).
| Demographics | Rating | Rank | In Labor Force | Age 20-24 |
| Eastern Europeans | 25.4 /100 | #195 | Fair 74.8% |
| Immigrants | Vietnam | 25.1 /100 | #196 | Fair 74.7% |
| Panamanians | 25.0 /100 | #197 | Fair 74.7% |
| Immigrants | Nigeria | 24.2 /100 | #198 | Fair 74.7% |
| Taiwanese | 23.2 /100 | #199 | Fair 74.7% |
| Nigerians | 21.9 /100 | #200 | Fair 74.7% |
| Choctaw | 21.4 /100 | #201 | Fair 74.7% |
| Moroccans | 20.4 /100 | #202 | Fair 74.7% |
| Immigrants | Northern Africa | 17.9 /100 | #203 | Poor 74.6% |
| Immigrants | Italy | 17.6 /100 | #204 | Poor 74.6% |
| Inupiat | 17.6 /100 | #205 | Poor 74.6% |
| Sioux | 17.5 /100 | #206 | Poor 74.6% |
| Albanians | 16.2 /100 | #207 | Poor 74.6% |
| Immigrants | Uruguay | 15.8 /100 | #208 | Poor 74.6% |
| Arabs | 15.8 /100 | #209 | Poor 74.6% |
Demographics Similar to Immigrants from Sweden by In Labor Force | Age 20-24
In terms of in labor force | age 20-24, the demographic groups most similar to Immigrants from Sweden are Immigrants from Albania (74.2%, a difference of 0.030%), Immigrants from Ukraine (74.2%, a difference of 0.040%), Immigrants from Greece (74.2%, a difference of 0.040%), Immigrants from Switzerland (74.2%, a difference of 0.050%), and Immigrants from Fiji (74.3%, a difference of 0.090%).
| Demographics | Rating | Rank | In Labor Force | Age 20-24 |
| Immigrants | India | 9.9 /100 | #222 | Tragic 74.4% |
| Hispanics or Latinos | 7.9 /100 | #223 | Tragic 74.4% |
| Seminole | 6.9 /100 | #224 | Tragic 74.3% |
| Ghanaians | 6.2 /100 | #225 | Tragic 74.3% |
| Immigrants | Fiji | 5.9 /100 | #226 | Tragic 74.3% |
| Immigrants | Ireland | 5.8 /100 | #227 | Tragic 74.3% |
| Immigrants | Ukraine | 5.1 /100 | #228 | Tragic 74.2% |
| Immigrants | Sweden | 4.6 /100 | #229 | Tragic 74.2% |
| Immigrants | Albania | 4.3 /100 | #230 | Tragic 74.2% |
| Immigrants | Greece | 4.1 /100 | #231 | Tragic 74.2% |
| Immigrants | Switzerland | 4.1 /100 | #232 | Tragic 74.2% |
| Immigrants | Chile | 3.7 /100 | #233 | Tragic 74.1% |
| Immigrants | Immigrants | 3.6 /100 | #234 | Tragic 74.1% |
| Laotians | 3.5 /100 | #235 | Tragic 74.1% |
| Immigrants | France | 3.3 /100 | #236 | Tragic 74.1% |