Paraguayan vs Immigrants from Sweden In Labor Force | Age 20-24
COMPARE
Paraguayan
Immigrants from Sweden
In Labor Force | Age 20-24
In Labor Force | Age 20-24 Comparison
Paraguayans
Immigrants from Sweden
73.7%
IN LABOR FORCE | AGE 20-24
0.8/ 100
METRIC RATING
257th/ 347
METRIC RANK
74.2%
IN LABOR FORCE | AGE 20-24
4.6/ 100
METRIC RATING
229th/ 347
METRIC RANK
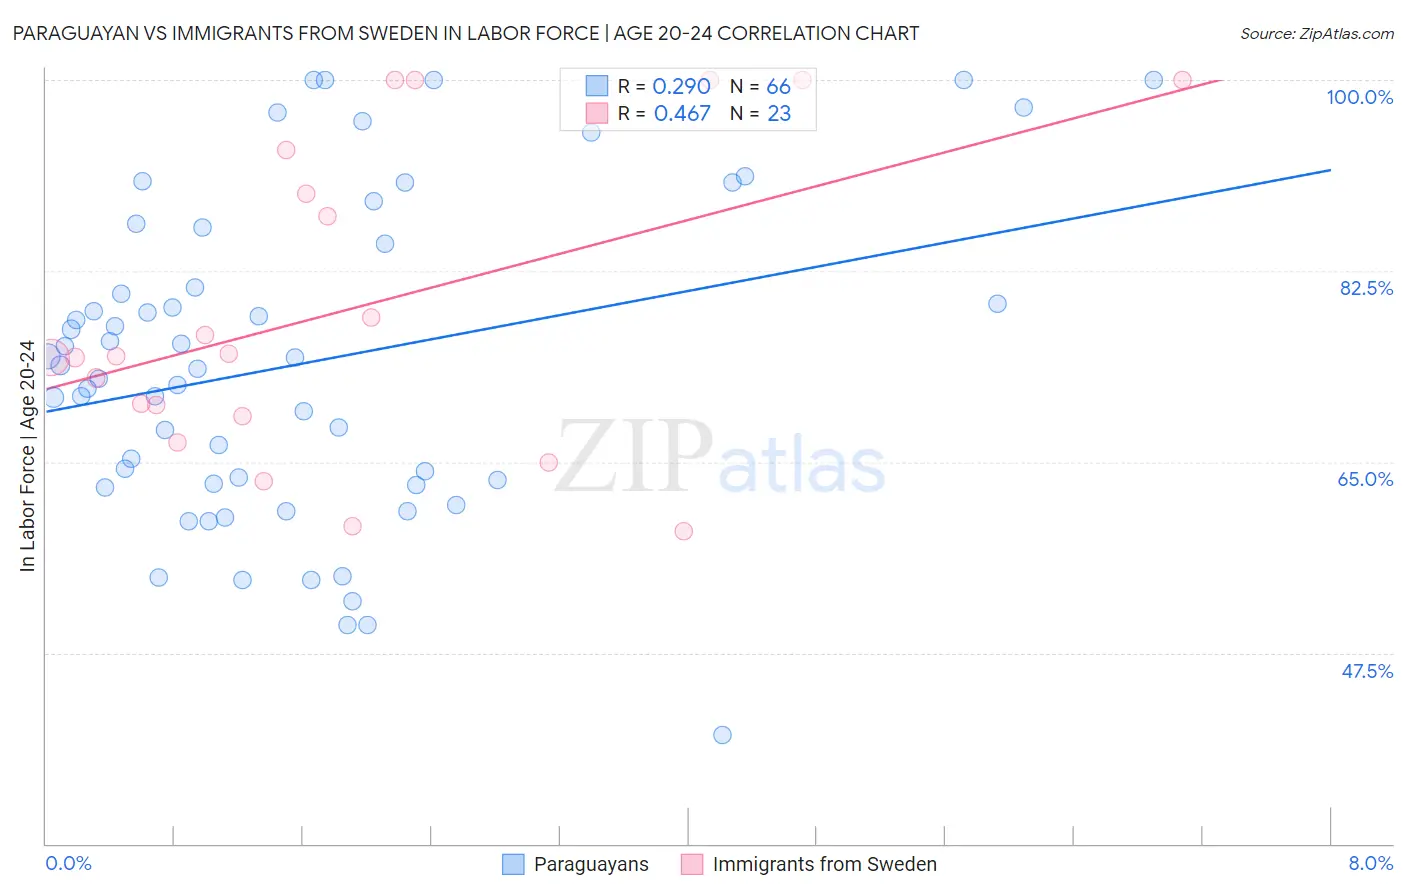
Paraguayan vs Immigrants from Sweden In Labor Force | Age 20-24 Correlation Chart
The statistical analysis conducted on geographies consisting of 95,113,378 people shows a weak positive correlation between the proportion of Paraguayans and labor force participation rate among population between the ages 20 and 24 in the United States with a correlation coefficient (R) of 0.290 and weighted average of 73.7%. Similarly, the statistical analysis conducted on geographies consisting of 164,691,562 people shows a moderate positive correlation between the proportion of Immigrants from Sweden and labor force participation rate among population between the ages 20 and 24 in the United States with a correlation coefficient (R) of 0.467 and weighted average of 74.2%, a difference of 0.67%.
In Labor Force | Age 20-24 Correlation Summary
| Measurement | Paraguayan | Immigrants from Sweden |
| Minimum | 40.0% | 58.6% |
| Maximum | 100.0% | 100.0% |
| Range | 60.0% | 41.4% |
| Mean | 74.1% | 79.1% |
| Median | 73.7% | 74.7% |
| Interquartile 25% (IQ1) | 63.0% | 69.2% |
| Interquartile 75% (IQ3) | 85.0% | 93.6% |
| Interquartile Range (IQR) | 22.0% | 24.4% |
| Standard Deviation (Sample) | 14.7% | 14.1% |
| Standard Deviation (Population) | 14.6% | 13.8% |
Similar Demographics by In Labor Force | Age 20-24
Demographics Similar to Paraguayans by In Labor Force | Age 20-24
In terms of in labor force | age 20-24, the demographic groups most similar to Paraguayans are Spanish American Indian (73.7%, a difference of 0.020%), Egyptian (73.7%, a difference of 0.040%), Dutch West Indian (73.7%, a difference of 0.040%), Immigrants from Pakistan (73.8%, a difference of 0.060%), and Immigrants from Turkey (73.7%, a difference of 0.070%).
| Demographics | Rating | Rank | In Labor Force | Age 20-24 |
| Immigrants | Belgium | 1.3 /100 | #250 | Tragic 73.9% |
| Immigrants | Egypt | 1.2 /100 | #251 | Tragic 73.8% |
| Immigrants | Kazakhstan | 1.1 /100 | #252 | Tragic 73.8% |
| Arapaho | 1.0 /100 | #253 | Tragic 73.8% |
| Ute | 1.0 /100 | #254 | Tragic 73.8% |
| Immigrants | Pakistan | 0.9 /100 | #255 | Tragic 73.8% |
| Spanish American Indians | 0.8 /100 | #256 | Tragic 73.7% |
| Paraguayans | 0.8 /100 | #257 | Tragic 73.7% |
| Egyptians | 0.7 /100 | #258 | Tragic 73.7% |
| Dutch West Indians | 0.7 /100 | #259 | Tragic 73.7% |
| Immigrants | Turkey | 0.7 /100 | #260 | Tragic 73.7% |
| Houma | 0.6 /100 | #261 | Tragic 73.7% |
| Asians | 0.6 /100 | #262 | Tragic 73.7% |
| Immigrants | Asia | 0.5 /100 | #263 | Tragic 73.6% |
| Immigrants | Haiti | 0.5 /100 | #264 | Tragic 73.6% |
Demographics Similar to Immigrants from Sweden by In Labor Force | Age 20-24
In terms of in labor force | age 20-24, the demographic groups most similar to Immigrants from Sweden are Immigrants from Albania (74.2%, a difference of 0.030%), Immigrants from Ukraine (74.2%, a difference of 0.040%), Immigrants from Greece (74.2%, a difference of 0.040%), Immigrants from Switzerland (74.2%, a difference of 0.050%), and Immigrants from Fiji (74.3%, a difference of 0.090%).
| Demographics | Rating | Rank | In Labor Force | Age 20-24 |
| Immigrants | India | 9.9 /100 | #222 | Tragic 74.4% |
| Hispanics or Latinos | 7.9 /100 | #223 | Tragic 74.4% |
| Seminole | 6.9 /100 | #224 | Tragic 74.3% |
| Ghanaians | 6.2 /100 | #225 | Tragic 74.3% |
| Immigrants | Fiji | 5.9 /100 | #226 | Tragic 74.3% |
| Immigrants | Ireland | 5.8 /100 | #227 | Tragic 74.3% |
| Immigrants | Ukraine | 5.1 /100 | #228 | Tragic 74.2% |
| Immigrants | Sweden | 4.6 /100 | #229 | Tragic 74.2% |
| Immigrants | Albania | 4.3 /100 | #230 | Tragic 74.2% |
| Immigrants | Greece | 4.1 /100 | #231 | Tragic 74.2% |
| Immigrants | Switzerland | 4.1 /100 | #232 | Tragic 74.2% |
| Immigrants | Chile | 3.7 /100 | #233 | Tragic 74.1% |
| Immigrants | Immigrants | 3.6 /100 | #234 | Tragic 74.1% |
| Laotians | 3.5 /100 | #235 | Tragic 74.1% |
| Immigrants | France | 3.3 /100 | #236 | Tragic 74.1% |