Immigrants from South Central Asia vs Immigrants from Sweden In Labor Force | Age 20-24
COMPARE
Immigrants from South Central Asia
Immigrants from Sweden
In Labor Force | Age 20-24
In Labor Force | Age 20-24 Comparison
Immigrants from South Central Asia
Immigrants from Sweden
74.0%
IN LABOR FORCE | AGE 20-24
1.9/ 100
METRIC RATING
244th/ 347
METRIC RANK
74.2%
IN LABOR FORCE | AGE 20-24
4.6/ 100
METRIC RATING
229th/ 347
METRIC RANK
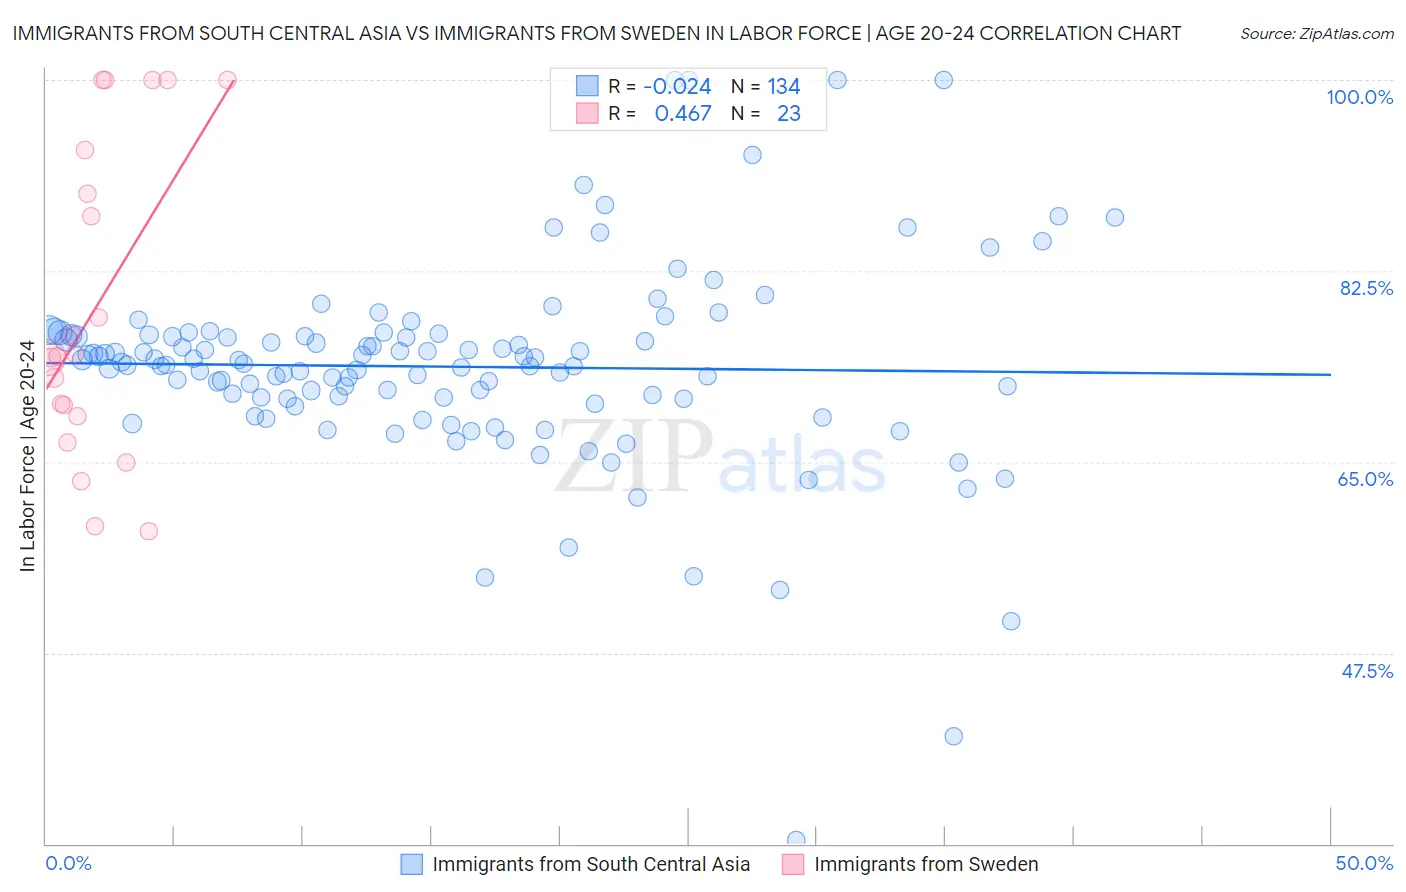
Immigrants from South Central Asia vs Immigrants from Sweden In Labor Force | Age 20-24 Correlation Chart
The statistical analysis conducted on geographies consisting of 472,891,637 people shows no correlation between the proportion of Immigrants from South Central Asia and labor force participation rate among population between the ages 20 and 24 in the United States with a correlation coefficient (R) of -0.024 and weighted average of 74.0%. Similarly, the statistical analysis conducted on geographies consisting of 164,691,562 people shows a moderate positive correlation between the proportion of Immigrants from Sweden and labor force participation rate among population between the ages 20 and 24 in the United States with a correlation coefficient (R) of 0.467 and weighted average of 74.2%, a difference of 0.35%.
In Labor Force | Age 20-24 Correlation Summary
| Measurement | Immigrants from South Central Asia | Immigrants from Sweden |
| Minimum | 30.3% | 58.6% |
| Maximum | 100.0% | 100.0% |
| Range | 69.7% | 41.4% |
| Mean | 73.7% | 79.1% |
| Median | 74.1% | 74.7% |
| Interquartile 25% (IQ1) | 70.8% | 69.2% |
| Interquartile 75% (IQ3) | 76.6% | 93.6% |
| Interquartile Range (IQR) | 5.8% | 24.4% |
| Standard Deviation (Sample) | 9.4% | 14.1% |
| Standard Deviation (Population) | 9.3% | 13.8% |
Demographics Similar to Immigrants from South Central Asia and Immigrants from Sweden by In Labor Force | Age 20-24
In terms of in labor force | age 20-24, the demographic groups most similar to Immigrants from South Central Asia are Immigrants from Syria (74.0%, a difference of 0.010%), Turkish (73.9%, a difference of 0.030%), Immigrants from Senegal (74.0%, a difference of 0.040%), Thai (74.0%, a difference of 0.040%), and Immigrants from Panama (73.9%, a difference of 0.060%). Similarly, the demographic groups most similar to Immigrants from Sweden are Immigrants from Albania (74.2%, a difference of 0.030%), Immigrants from Ukraine (74.2%, a difference of 0.040%), Immigrants from Greece (74.2%, a difference of 0.040%), Immigrants from Switzerland (74.2%, a difference of 0.050%), and Immigrants from Fiji (74.3%, a difference of 0.090%).
| Demographics | Rating | Rank | In Labor Force | Age 20-24 |
| Immigrants | Fiji | 5.9 /100 | #226 | Tragic 74.3% |
| Immigrants | Ireland | 5.8 /100 | #227 | Tragic 74.3% |
| Immigrants | Ukraine | 5.1 /100 | #228 | Tragic 74.2% |
| Immigrants | Sweden | 4.6 /100 | #229 | Tragic 74.2% |
| Immigrants | Albania | 4.3 /100 | #230 | Tragic 74.2% |
| Immigrants | Greece | 4.1 /100 | #231 | Tragic 74.2% |
| Immigrants | Switzerland | 4.1 /100 | #232 | Tragic 74.2% |
| Immigrants | Chile | 3.7 /100 | #233 | Tragic 74.1% |
| Immigrants | Immigrants | 3.6 /100 | #234 | Tragic 74.1% |
| Laotians | 3.5 /100 | #235 | Tragic 74.1% |
| Immigrants | France | 3.3 /100 | #236 | Tragic 74.1% |
| Bermudans | 3.2 /100 | #237 | Tragic 74.1% |
| Immigrants | Japan | 3.0 /100 | #238 | Tragic 74.1% |
| Immigrants | Latin America | 2.7 /100 | #239 | Tragic 74.1% |
| Immigrants | Sri Lanka | 2.3 /100 | #240 | Tragic 74.0% |
| Immigrants | Senegal | 2.1 /100 | #241 | Tragic 74.0% |
| Thais | 2.1 /100 | #242 | Tragic 74.0% |
| Immigrants | Syria | 1.9 /100 | #243 | Tragic 74.0% |
| Immigrants | South Central Asia | 1.9 /100 | #244 | Tragic 74.0% |
| Turks | 1.8 /100 | #245 | Tragic 73.9% |
| Immigrants | Panama | 1.6 /100 | #246 | Tragic 73.9% |