Mexican vs Immigrants from Albania In Labor Force | Age 20-64
COMPARE
Mexican
Immigrants from Albania
In Labor Force | Age 20-64
In Labor Force | Age 20-64 Comparison
Mexicans
Immigrants from Albania
77.2%
IN LABOR FORCE | AGE 20-64
0.0/ 100
METRIC RATING
305th/ 347
METRIC RANK
80.3%
IN LABOR FORCE | AGE 20-64
98.7/ 100
METRIC RATING
64th/ 347
METRIC RANK
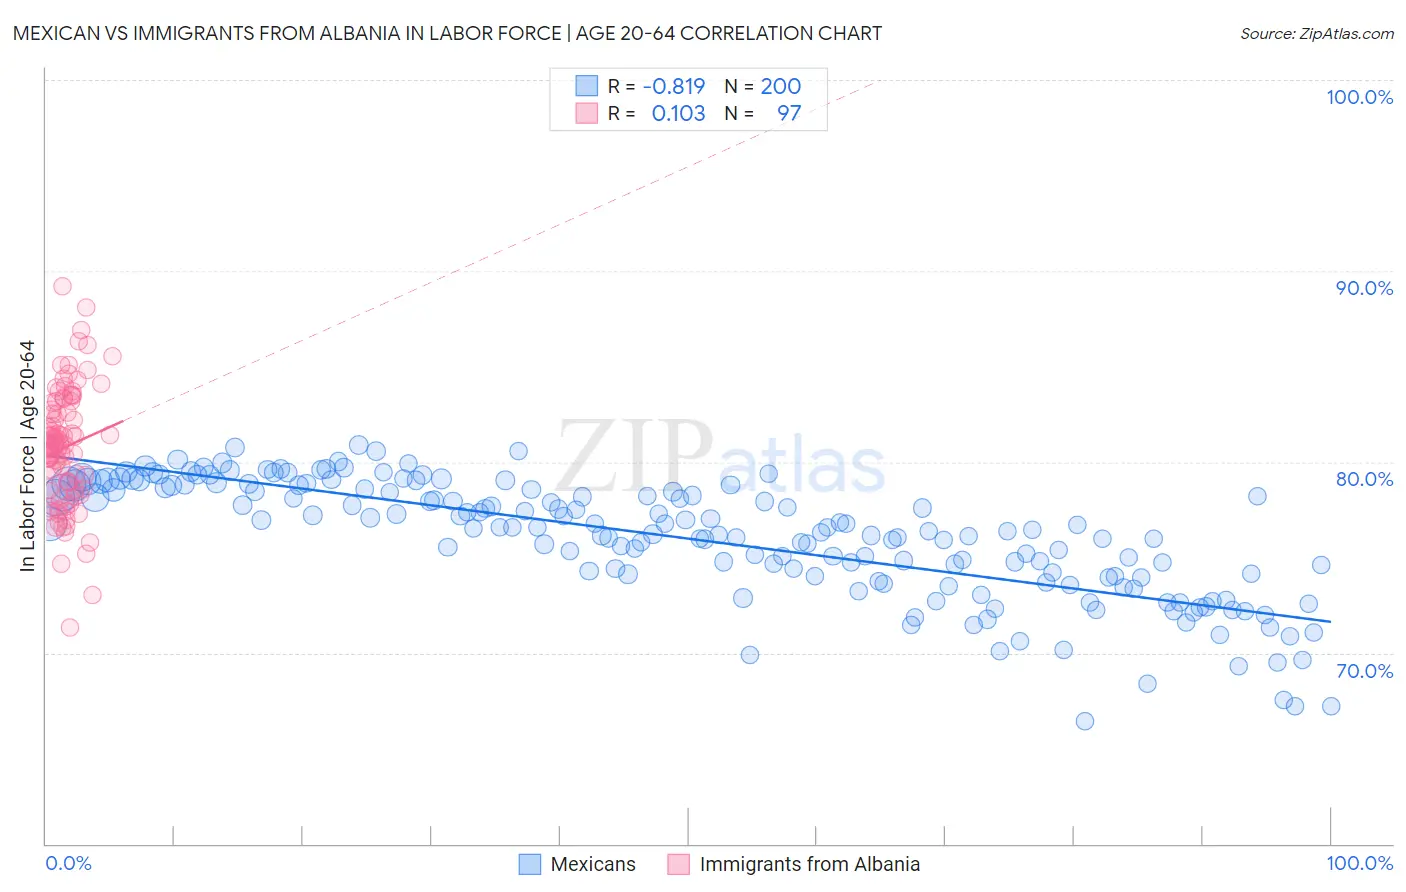
Mexican vs Immigrants from Albania In Labor Force | Age 20-64 Correlation Chart
The statistical analysis conducted on geographies consisting of 565,322,836 people shows a very strong negative correlation between the proportion of Mexicans and labor force participation rate among population between the ages 20 and 64 in the United States with a correlation coefficient (R) of -0.819 and weighted average of 77.2%. Similarly, the statistical analysis conducted on geographies consisting of 119,398,682 people shows a poor positive correlation between the proportion of Immigrants from Albania and labor force participation rate among population between the ages 20 and 64 in the United States with a correlation coefficient (R) of 0.103 and weighted average of 80.3%, a difference of 3.9%.
In Labor Force | Age 20-64 Correlation Summary
| Measurement | Mexican | Immigrants from Albania |
| Minimum | 66.4% | 71.3% |
| Maximum | 80.9% | 89.2% |
| Range | 14.5% | 17.9% |
| Mean | 76.0% | 80.8% |
| Median | 76.5% | 80.9% |
| Interquartile 25% (IQ1) | 74.0% | 78.5% |
| Interquartile 75% (IQ3) | 78.6% | 83.1% |
| Interquartile Range (IQR) | 4.5% | 4.6% |
| Standard Deviation (Sample) | 3.1% | 3.2% |
| Standard Deviation (Population) | 3.1% | 3.1% |
Similar Demographics by In Labor Force | Age 20-64
Demographics Similar to Mexicans by In Labor Force | Age 20-64
In terms of in labor force | age 20-64, the demographic groups most similar to Mexicans are Potawatomi (77.2%, a difference of 0.020%), Immigrants from Mexico (77.3%, a difference of 0.040%), Chippewa (77.3%, a difference of 0.11%), Central American Indian (77.1%, a difference of 0.19%), and Alaska Native (77.0%, a difference of 0.25%).
| Demographics | Rating | Rank | In Labor Force | Age 20-64 |
| Cree | 0.0 /100 | #298 | Tragic 77.7% |
| Hispanics or Latinos | 0.0 /100 | #299 | Tragic 77.6% |
| Spanish American Indians | 0.0 /100 | #300 | Tragic 77.6% |
| Nepalese | 0.0 /100 | #301 | Tragic 77.5% |
| Iroquois | 0.0 /100 | #302 | Tragic 77.5% |
| Chippewa | 0.0 /100 | #303 | Tragic 77.3% |
| Immigrants | Mexico | 0.0 /100 | #304 | Tragic 77.3% |
| Mexicans | 0.0 /100 | #305 | Tragic 77.2% |
| Potawatomi | 0.0 /100 | #306 | Tragic 77.2% |
| Central American Indians | 0.0 /100 | #307 | Tragic 77.1% |
| Alaska Natives | 0.0 /100 | #308 | Tragic 77.0% |
| Americans | 0.0 /100 | #309 | Tragic 77.0% |
| Comanche | 0.0 /100 | #310 | Tragic 77.0% |
| Blackfeet | 0.0 /100 | #311 | Tragic 77.0% |
| Alaskan Athabascans | 0.0 /100 | #312 | Tragic 76.9% |
Demographics Similar to Immigrants from Albania by In Labor Force | Age 20-64
In terms of in labor force | age 20-64, the demographic groups most similar to Immigrants from Albania are Immigrants from Korea (80.3%, a difference of 0.0%), Carpatho Rusyn (80.3%, a difference of 0.010%), Lithuanian (80.2%, a difference of 0.010%), Macedonian (80.2%, a difference of 0.010%), and Taiwanese (80.2%, a difference of 0.010%).
| Demographics | Rating | Rank | In Labor Force | Age 20-64 |
| Afghans | 98.9 /100 | #57 | Exceptional 80.3% |
| Serbians | 98.9 /100 | #58 | Exceptional 80.3% |
| Swedes | 98.9 /100 | #59 | Exceptional 80.3% |
| Tongans | 98.8 /100 | #60 | Exceptional 80.3% |
| Burmese | 98.8 /100 | #61 | Exceptional 80.3% |
| Carpatho Rusyns | 98.8 /100 | #62 | Exceptional 80.3% |
| Immigrants | Korea | 98.8 /100 | #63 | Exceptional 80.3% |
| Immigrants | Albania | 98.7 /100 | #64 | Exceptional 80.3% |
| Lithuanians | 98.7 /100 | #65 | Exceptional 80.2% |
| Macedonians | 98.7 /100 | #66 | Exceptional 80.2% |
| Taiwanese | 98.6 /100 | #67 | Exceptional 80.2% |
| Bhutanese | 98.6 /100 | #68 | Exceptional 80.2% |
| Albanians | 98.6 /100 | #69 | Exceptional 80.2% |
| Immigrants | Turkey | 98.5 /100 | #70 | Exceptional 80.2% |
| Soviet Union | 98.5 /100 | #71 | Exceptional 80.2% |