Immigrants from Chile vs Australian In Labor Force | Age 45-54
COMPARE
Immigrants from Chile
Australian
In Labor Force | Age 45-54
In Labor Force | Age 45-54 Comparison
Immigrants from Chile
Australians
83.2%
IN LABOR FORCE | AGE 45-54
91.6/ 100
METRIC RATING
115th/ 347
METRIC RANK
82.5%
IN LABOR FORCE | AGE 45-54
20.8/ 100
METRIC RATING
193rd/ 347
METRIC RANK
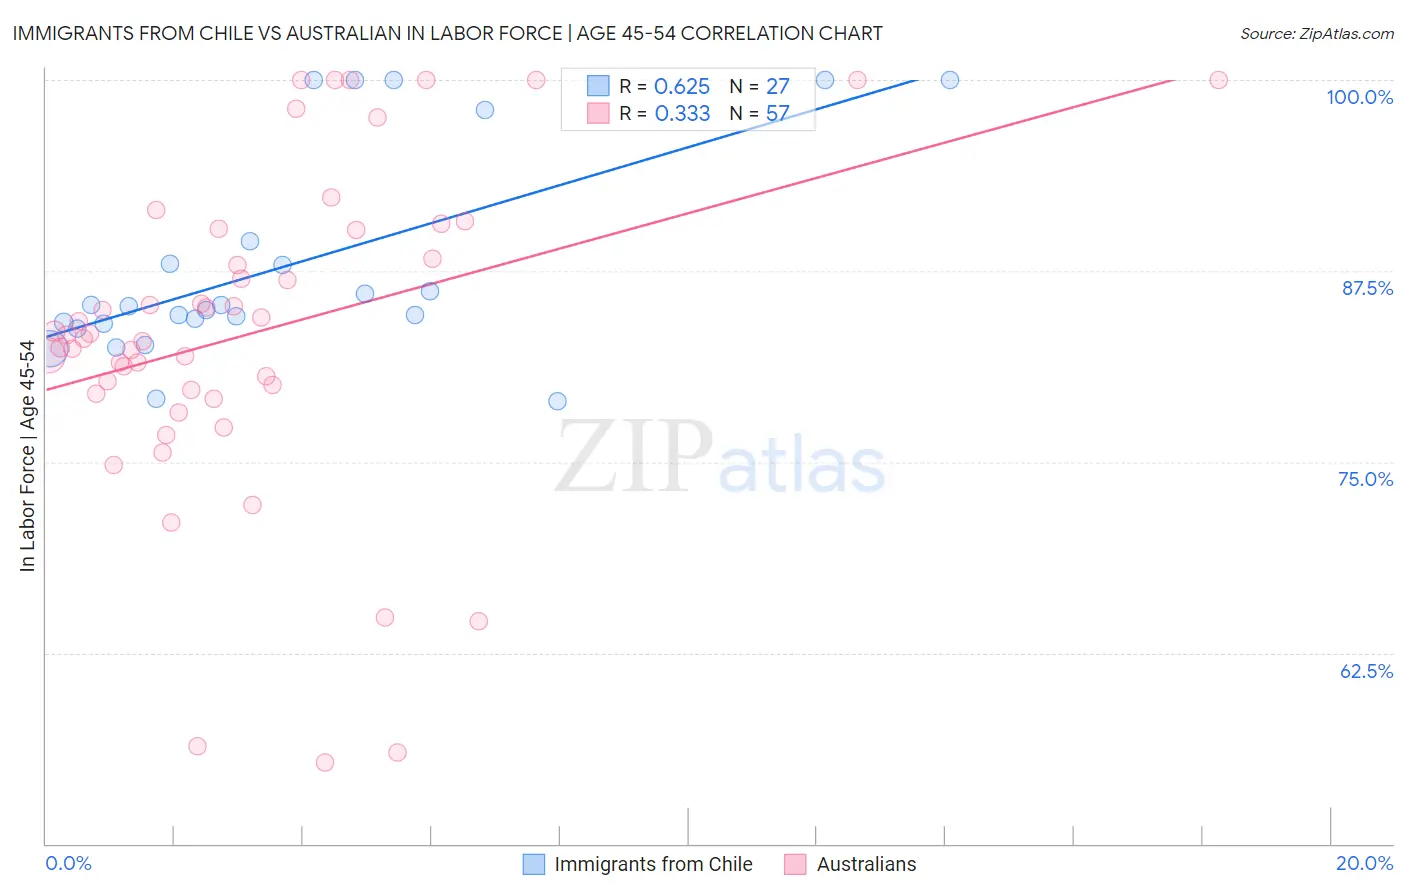
Immigrants from Chile vs Australian In Labor Force | Age 45-54 Correlation Chart
The statistical analysis conducted on geographies consisting of 218,594,032 people shows a significant positive correlation between the proportion of Immigrants from Chile and labor force participation rate among population between the ages 45 and 54 in the United States with a correlation coefficient (R) of 0.625 and weighted average of 83.2%. Similarly, the statistical analysis conducted on geographies consisting of 224,028,437 people shows a mild positive correlation between the proportion of Australians and labor force participation rate among population between the ages 45 and 54 in the United States with a correlation coefficient (R) of 0.333 and weighted average of 82.5%, a difference of 0.82%.
In Labor Force | Age 45-54 Correlation Summary
| Measurement | Immigrants from Chile | Australian |
| Minimum | 79.0% | 55.3% |
| Maximum | 100.0% | 100.0% |
| Range | 21.0% | 44.7% |
| Mean | 87.8% | 83.5% |
| Median | 85.1% | 83.3% |
| Interquartile 25% (IQ1) | 84.1% | 79.6% |
| Interquartile 75% (IQ3) | 89.5% | 90.2% |
| Interquartile Range (IQR) | 5.4% | 10.6% |
| Standard Deviation (Sample) | 6.8% | 10.7% |
| Standard Deviation (Population) | 6.7% | 10.6% |
Similar Demographics by In Labor Force | Age 45-54
Demographics Similar to Immigrants from Chile by In Labor Force | Age 45-54
In terms of in labor force | age 45-54, the demographic groups most similar to Immigrants from Chile are Assyrian/Chaldean/Syriac (83.2%, a difference of 0.0%), Immigrants from Malaysia (83.2%, a difference of 0.0%), Immigrants from Albania (83.2%, a difference of 0.010%), Immigrants from Afghanistan (83.2%, a difference of 0.020%), and Immigrants from China (83.2%, a difference of 0.020%).
| Demographics | Rating | Rank | In Labor Force | Age 45-54 |
| Slovaks | 92.8 /100 | #108 | Exceptional 83.2% |
| Ukrainians | 92.7 /100 | #109 | Exceptional 83.2% |
| Immigrants | Africa | 92.6 /100 | #110 | Exceptional 83.2% |
| Immigrants | Italy | 92.5 /100 | #111 | Exceptional 83.2% |
| Immigrants | Afghanistan | 92.4 /100 | #112 | Exceptional 83.2% |
| Immigrants | Albania | 91.8 /100 | #113 | Exceptional 83.2% |
| Assyrians/Chaldeans/Syriacs | 91.7 /100 | #114 | Exceptional 83.2% |
| Immigrants | Chile | 91.6 /100 | #115 | Exceptional 83.2% |
| Immigrants | Malaysia | 91.4 /100 | #116 | Exceptional 83.2% |
| Immigrants | China | 90.9 /100 | #117 | Exceptional 83.2% |
| Immigrants | Europe | 90.7 /100 | #118 | Exceptional 83.2% |
| Immigrants | Uruguay | 90.2 /100 | #119 | Exceptional 83.2% |
| Immigrants | Russia | 90.1 /100 | #120 | Exceptional 83.2% |
| Uruguayans | 89.4 /100 | #121 | Excellent 83.1% |
| Immigrants | Vietnam | 88.9 /100 | #122 | Excellent 83.1% |
Demographics Similar to Australians by In Labor Force | Age 45-54
In terms of in labor force | age 45-54, the demographic groups most similar to Australians are Immigrants from Iraq (82.5%, a difference of 0.0%), Immigrants from Norway (82.5%, a difference of 0.0%), Immigrants from Canada (82.5%, a difference of 0.010%), Armenian (82.5%, a difference of 0.030%), and Immigrants from North America (82.5%, a difference of 0.030%).
| Demographics | Rating | Rank | In Labor Force | Age 45-54 |
| Irish | 29.2 /100 | #186 | Fair 82.6% |
| Immigrants | Costa Rica | 28.3 /100 | #187 | Fair 82.6% |
| South Africans | 28.0 /100 | #188 | Fair 82.6% |
| Syrians | 26.0 /100 | #189 | Fair 82.6% |
| British | 25.7 /100 | #190 | Fair 82.6% |
| Armenians | 23.2 /100 | #191 | Fair 82.5% |
| Immigrants | Iraq | 20.9 /100 | #192 | Fair 82.5% |
| Australians | 20.8 /100 | #193 | Fair 82.5% |
| Immigrants | Norway | 20.7 /100 | #194 | Fair 82.5% |
| Immigrants | Canada | 20.0 /100 | #195 | Fair 82.5% |
| Immigrants | North America | 18.8 /100 | #196 | Poor 82.5% |
| Lebanese | 18.2 /100 | #197 | Poor 82.5% |
| Immigrants | Denmark | 17.9 /100 | #198 | Poor 82.5% |
| Moroccans | 15.7 /100 | #199 | Poor 82.5% |
| French Canadians | 15.4 /100 | #200 | Poor 82.5% |