Immigrants from Chile vs Menominee In Labor Force | Age 45-54
COMPARE
Immigrants from Chile
Menominee
In Labor Force | Age 45-54
In Labor Force | Age 45-54 Comparison
Immigrants from Chile
Menominee
83.2%
IN LABOR FORCE | AGE 45-54
91.6/ 100
METRIC RATING
115th/ 347
METRIC RANK
77.4%
IN LABOR FORCE | AGE 45-54
0.0/ 100
METRIC RATING
332nd/ 347
METRIC RANK
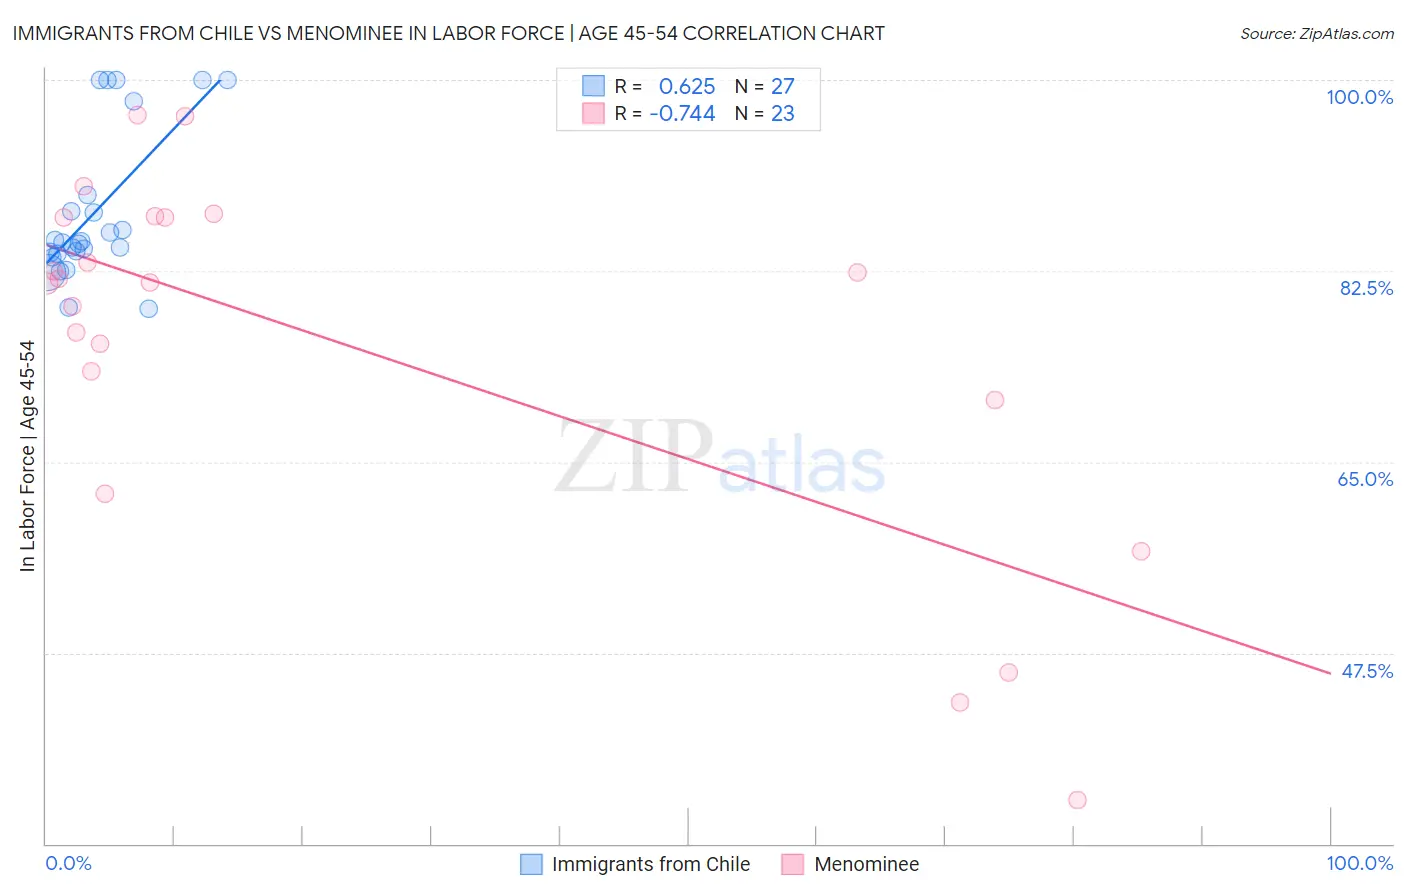
Immigrants from Chile vs Menominee In Labor Force | Age 45-54 Correlation Chart
The statistical analysis conducted on geographies consisting of 218,594,032 people shows a significant positive correlation between the proportion of Immigrants from Chile and labor force participation rate among population between the ages 45 and 54 in the United States with a correlation coefficient (R) of 0.625 and weighted average of 83.2%. Similarly, the statistical analysis conducted on geographies consisting of 45,777,282 people shows a strong negative correlation between the proportion of Menominee and labor force participation rate among population between the ages 45 and 54 in the United States with a correlation coefficient (R) of -0.744 and weighted average of 77.4%, a difference of 7.5%.
In Labor Force | Age 45-54 Correlation Summary
| Measurement | Immigrants from Chile | Menominee |
| Minimum | 79.0% | 34.0% |
| Maximum | 100.0% | 96.8% |
| Range | 21.0% | 62.8% |
| Mean | 87.8% | 75.8% |
| Median | 85.1% | 81.4% |
| Interquartile 25% (IQ1) | 84.1% | 70.7% |
| Interquartile 75% (IQ3) | 89.5% | 87.4% |
| Interquartile Range (IQR) | 5.4% | 16.7% |
| Standard Deviation (Sample) | 6.8% | 16.8% |
| Standard Deviation (Population) | 6.7% | 16.4% |
Similar Demographics by In Labor Force | Age 45-54
Demographics Similar to Immigrants from Chile by In Labor Force | Age 45-54
In terms of in labor force | age 45-54, the demographic groups most similar to Immigrants from Chile are Assyrian/Chaldean/Syriac (83.2%, a difference of 0.0%), Immigrants from Malaysia (83.2%, a difference of 0.0%), Immigrants from Albania (83.2%, a difference of 0.010%), Immigrants from Afghanistan (83.2%, a difference of 0.020%), and Immigrants from China (83.2%, a difference of 0.020%).
| Demographics | Rating | Rank | In Labor Force | Age 45-54 |
| Slovaks | 92.8 /100 | #108 | Exceptional 83.2% |
| Ukrainians | 92.7 /100 | #109 | Exceptional 83.2% |
| Immigrants | Africa | 92.6 /100 | #110 | Exceptional 83.2% |
| Immigrants | Italy | 92.5 /100 | #111 | Exceptional 83.2% |
| Immigrants | Afghanistan | 92.4 /100 | #112 | Exceptional 83.2% |
| Immigrants | Albania | 91.8 /100 | #113 | Exceptional 83.2% |
| Assyrians/Chaldeans/Syriacs | 91.7 /100 | #114 | Exceptional 83.2% |
| Immigrants | Chile | 91.6 /100 | #115 | Exceptional 83.2% |
| Immigrants | Malaysia | 91.4 /100 | #116 | Exceptional 83.2% |
| Immigrants | China | 90.9 /100 | #117 | Exceptional 83.2% |
| Immigrants | Europe | 90.7 /100 | #118 | Exceptional 83.2% |
| Immigrants | Uruguay | 90.2 /100 | #119 | Exceptional 83.2% |
| Immigrants | Russia | 90.1 /100 | #120 | Exceptional 83.2% |
| Uruguayans | 89.4 /100 | #121 | Excellent 83.1% |
| Immigrants | Vietnam | 88.9 /100 | #122 | Excellent 83.1% |
Demographics Similar to Menominee by In Labor Force | Age 45-54
In terms of in labor force | age 45-54, the demographic groups most similar to Menominee are Tsimshian (77.4%, a difference of 0.030%), Cheyenne (77.6%, a difference of 0.18%), Native/Alaskan (77.1%, a difference of 0.36%), Apache (77.1%, a difference of 0.36%), and Creek (77.7%, a difference of 0.41%).
| Demographics | Rating | Rank | In Labor Force | Age 45-54 |
| Choctaw | 0.0 /100 | #325 | Tragic 78.2% |
| Seminole | 0.0 /100 | #326 | Tragic 78.1% |
| Cajuns | 0.0 /100 | #327 | Tragic 78.1% |
| Sioux | 0.0 /100 | #328 | Tragic 78.0% |
| Creek | 0.0 /100 | #329 | Tragic 77.7% |
| Cheyenne | 0.0 /100 | #330 | Tragic 77.6% |
| Tsimshian | 0.0 /100 | #331 | Tragic 77.4% |
| Menominee | 0.0 /100 | #332 | Tragic 77.4% |
| Natives/Alaskans | 0.0 /100 | #333 | Tragic 77.1% |
| Apache | 0.0 /100 | #334 | Tragic 77.1% |
| Arapaho | 0.0 /100 | #335 | Tragic 77.1% |
| Paiute | 0.0 /100 | #336 | Tragic 76.7% |
| Ute | 0.0 /100 | #337 | Tragic 76.6% |
| Yuman | 0.0 /100 | #338 | Tragic 76.3% |
| Puerto Ricans | 0.0 /100 | #339 | Tragic 75.9% |