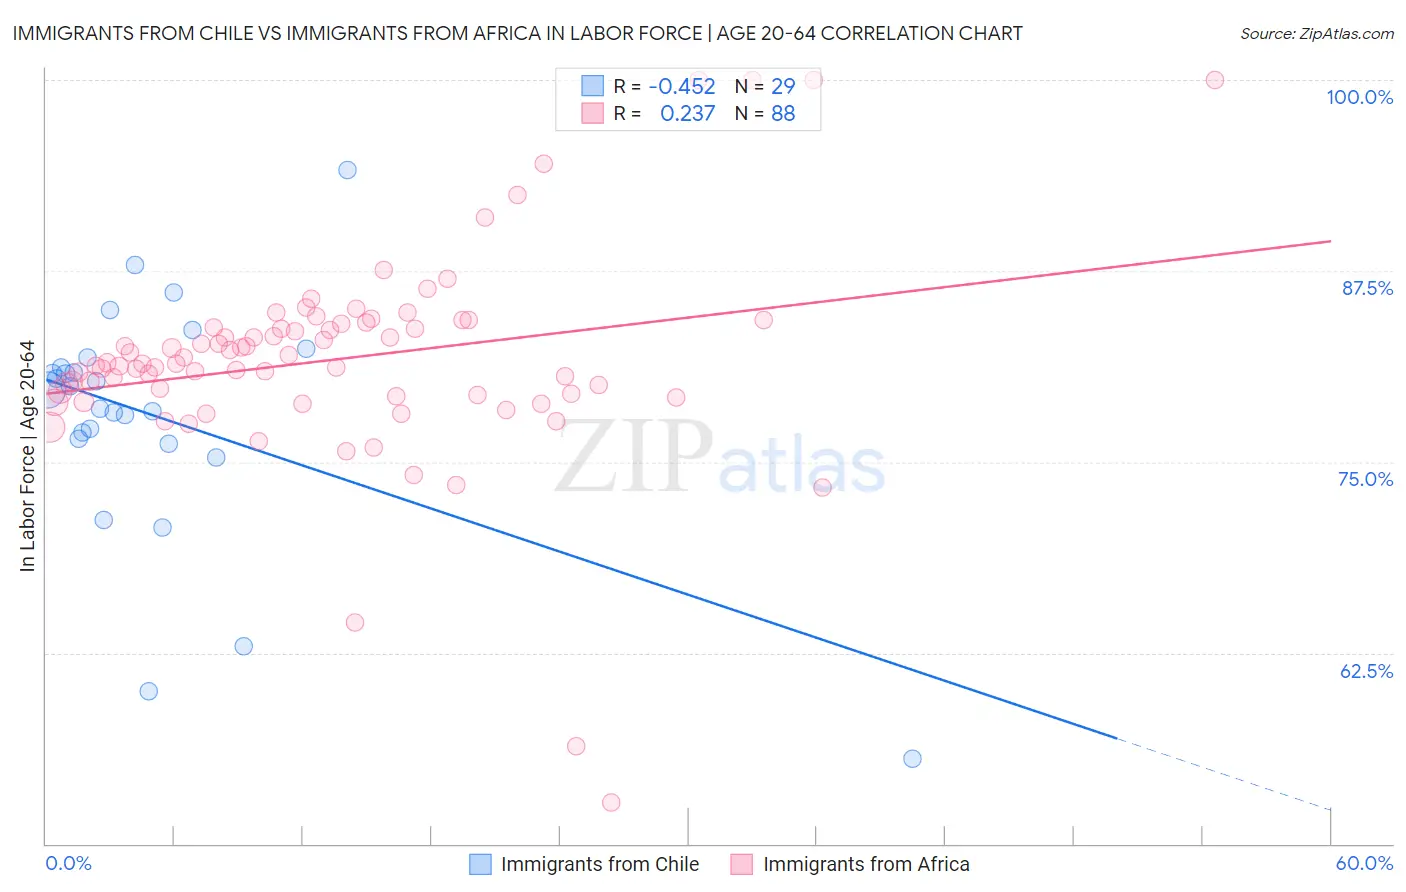
Immigrants from Chile vs Immigrants from Africa In Labor Force | Age 20-64
COMPARE
Immigrants from Chile
Immigrants from Africa
In Labor Force | Age 20-64
In Labor Force | Age 20-64 Comparison
Immigrants from Chile
Immigrants from Africa
80.1%
IN LABOR FORCE | AGE 20-64
95.7/ 100
METRIC RATING
99th/ 347
METRIC RANK
80.4%
IN LABOR FORCE | AGE 20-64
99.6/ 100
METRIC RATING
47th/ 347
METRIC RANK
Immigrants from Chile vs Immigrants from Africa In Labor Force | Age 20-64 Correlation Chart
The statistical analysis conducted on geographies consisting of 218,647,266 people shows a moderate negative correlation between the proportion of Immigrants from Chile and labor force participation rate among population between the ages 20 and 64 in the United States with a correlation coefficient (R) of -0.452 and weighted average of 80.1%. Similarly, the statistical analysis conducted on geographies consisting of 469,448,483 people shows a weak positive correlation between the proportion of Immigrants from Africa and labor force participation rate among population between the ages 20 and 64 in the United States with a correlation coefficient (R) of 0.237 and weighted average of 80.4%, a difference of 0.47%.
In Labor Force | Age 20-64 Correlation Summary
| Measurement | Immigrants from Chile | Immigrants from Africa |
| Minimum | 55.6% | 52.7% |
| Maximum | 94.1% | 100.0% |
| Range | 38.5% | 47.3% |
| Mean | 77.9% | 81.7% |
| Median | 79.7% | 81.4% |
| Interquartile 25% (IQ1) | 76.4% | 79.4% |
| Interquartile 75% (IQ3) | 81.5% | 83.9% |
| Interquartile Range (IQR) | 5.2% | 4.6% |
| Standard Deviation (Sample) | 7.9% | 6.9% |
| Standard Deviation (Population) | 7.8% | 6.9% |
Similar Demographics by In Labor Force | Age 20-64
Demographics Similar to Immigrants from Chile by In Labor Force | Age 20-64
In terms of in labor force | age 20-64, the demographic groups most similar to Immigrants from Chile are Yugoslavian (80.1%, a difference of 0.010%), Immigrants from Malaysia (80.1%, a difference of 0.010%), South American (80.1%, a difference of 0.010%), Immigrants from Uruguay (80.1%, a difference of 0.010%), and Filipino (80.1%, a difference of 0.010%).
| Demographics | Rating | Rank | In Labor Force | Age 20-64 |
| Ghanaians | 96.7 /100 | #92 | Exceptional 80.1% |
| Immigrants | Belarus | 96.4 /100 | #93 | Exceptional 80.1% |
| Immigrants | Asia | 96.0 /100 | #94 | Exceptional 80.1% |
| Yugoslavians | 95.9 /100 | #95 | Exceptional 80.1% |
| Immigrants | Malaysia | 95.9 /100 | #96 | Exceptional 80.1% |
| South Americans | 95.9 /100 | #97 | Exceptional 80.1% |
| Immigrants | Uruguay | 95.8 /100 | #98 | Exceptional 80.1% |
| Immigrants | Chile | 95.7 /100 | #99 | Exceptional 80.1% |
| Filipinos | 95.6 /100 | #100 | Exceptional 80.1% |
| Palestinians | 95.5 /100 | #101 | Exceptional 80.0% |
| Immigrants | Australia | 95.5 /100 | #102 | Exceptional 80.0% |
| Russians | 95.5 /100 | #103 | Exceptional 80.0% |
| Venezuelans | 95.3 /100 | #104 | Exceptional 80.0% |
| Immigrants | Ghana | 95.0 /100 | #105 | Exceptional 80.0% |
| Greeks | 94.8 /100 | #106 | Exceptional 80.0% |
Demographics Similar to Immigrants from Africa by In Labor Force | Age 20-64
In terms of in labor force | age 20-64, the demographic groups most similar to Immigrants from Africa are Immigrants from Hong Kong (80.4%, a difference of 0.020%), Slovene (80.5%, a difference of 0.040%), Immigrants from Pakistan (80.5%, a difference of 0.040%), Immigrants from Greece (80.4%, a difference of 0.060%), and Immigrants from Middle Africa (80.5%, a difference of 0.070%).
| Demographics | Rating | Rank | In Labor Force | Age 20-64 |
| Immigrants | Zimbabwe | 99.8 /100 | #40 | Exceptional 80.5% |
| Immigrants | Liberia | 99.8 /100 | #41 | Exceptional 80.5% |
| Latvians | 99.8 /100 | #42 | Exceptional 80.5% |
| Czechs | 99.7 /100 | #43 | Exceptional 80.5% |
| Immigrants | Middle Africa | 99.7 /100 | #44 | Exceptional 80.5% |
| Slovenes | 99.7 /100 | #45 | Exceptional 80.5% |
| Immigrants | Pakistan | 99.6 /100 | #46 | Exceptional 80.5% |
| Immigrants | Africa | 99.6 /100 | #47 | Exceptional 80.4% |
| Immigrants | Hong Kong | 99.5 /100 | #48 | Exceptional 80.4% |
| Immigrants | Greece | 99.4 /100 | #49 | Exceptional 80.4% |
| Immigrants | Sudan | 99.4 /100 | #50 | Exceptional 80.4% |
| Immigrants | Sri Lanka | 99.3 /100 | #51 | Exceptional 80.4% |
| Turks | 99.2 /100 | #52 | Exceptional 80.3% |
| Immigrants | Peru | 99.2 /100 | #53 | Exceptional 80.3% |
| Peruvians | 99.1 /100 | #54 | Exceptional 80.3% |