Immigrants from Chile vs Macedonian In Labor Force | Age 20-64
COMPARE
Immigrants from Chile
Macedonian
In Labor Force | Age 20-64
In Labor Force | Age 20-64 Comparison
Immigrants from Chile
Macedonians
80.1%
IN LABOR FORCE | AGE 20-64
95.7/ 100
METRIC RATING
99th/ 347
METRIC RANK
80.2%
IN LABOR FORCE | AGE 20-64
98.7/ 100
METRIC RATING
66th/ 347
METRIC RANK
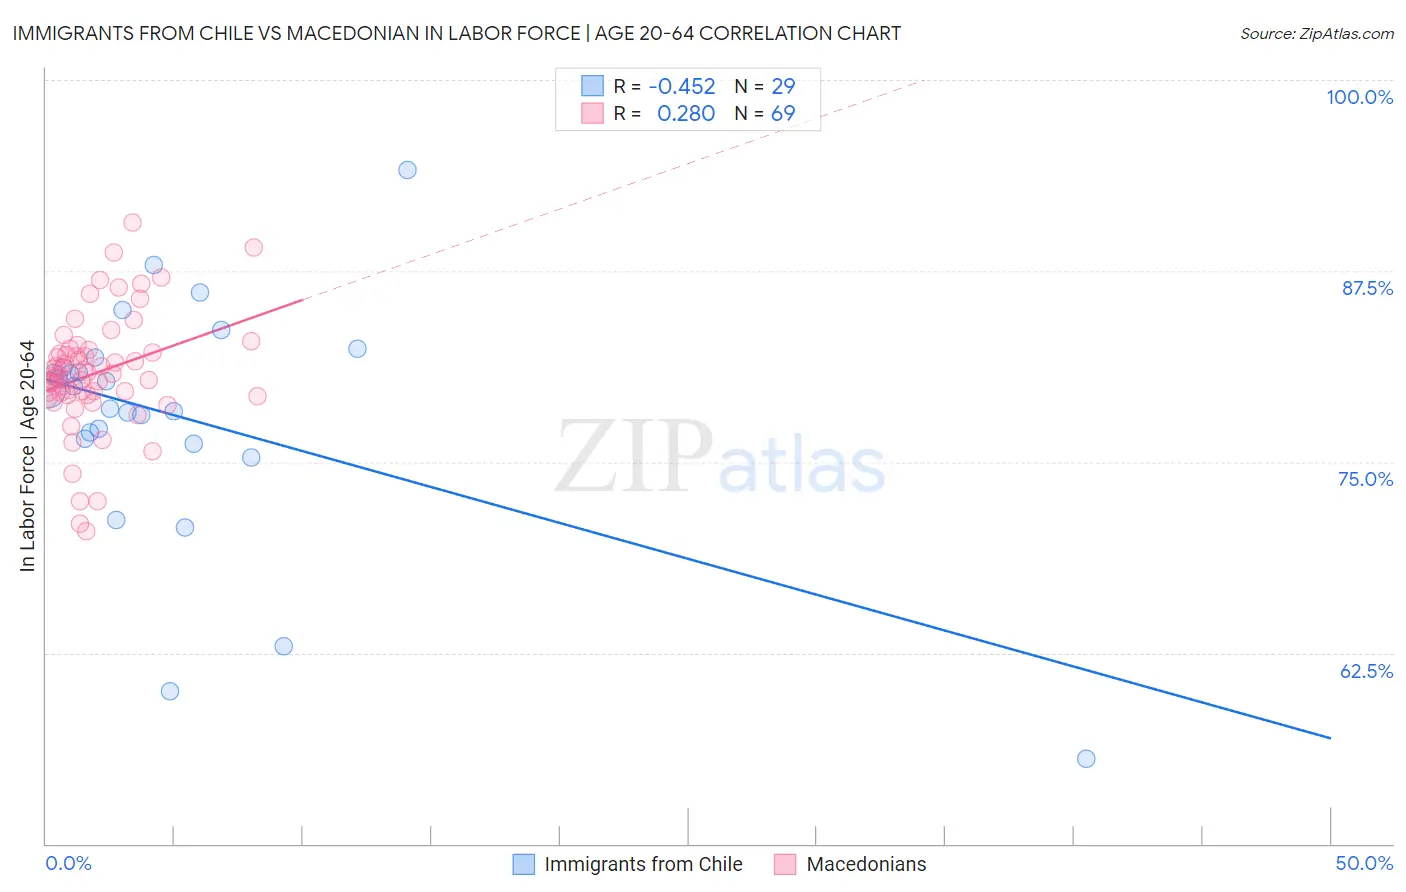
Immigrants from Chile vs Macedonian In Labor Force | Age 20-64 Correlation Chart
The statistical analysis conducted on geographies consisting of 218,647,266 people shows a moderate negative correlation between the proportion of Immigrants from Chile and labor force participation rate among population between the ages 20 and 64 in the United States with a correlation coefficient (R) of -0.452 and weighted average of 80.1%. Similarly, the statistical analysis conducted on geographies consisting of 132,660,351 people shows a weak positive correlation between the proportion of Macedonians and labor force participation rate among population between the ages 20 and 64 in the United States with a correlation coefficient (R) of 0.280 and weighted average of 80.2%, a difference of 0.24%.
In Labor Force | Age 20-64 Correlation Summary
| Measurement | Immigrants from Chile | Macedonian |
| Minimum | 55.6% | 70.5% |
| Maximum | 94.1% | 90.7% |
| Range | 38.5% | 20.2% |
| Mean | 77.9% | 80.8% |
| Median | 79.7% | 80.7% |
| Interquartile 25% (IQ1) | 76.4% | 79.4% |
| Interquartile 75% (IQ3) | 81.5% | 82.3% |
| Interquartile Range (IQR) | 5.2% | 2.9% |
| Standard Deviation (Sample) | 7.9% | 3.8% |
| Standard Deviation (Population) | 7.8% | 3.8% |
Similar Demographics by In Labor Force | Age 20-64
Demographics Similar to Immigrants from Chile by In Labor Force | Age 20-64
In terms of in labor force | age 20-64, the demographic groups most similar to Immigrants from Chile are Yugoslavian (80.1%, a difference of 0.010%), Immigrants from Malaysia (80.1%, a difference of 0.010%), South American (80.1%, a difference of 0.010%), Immigrants from Uruguay (80.1%, a difference of 0.010%), and Filipino (80.1%, a difference of 0.010%).
| Demographics | Rating | Rank | In Labor Force | Age 20-64 |
| Ghanaians | 96.7 /100 | #92 | Exceptional 80.1% |
| Immigrants | Belarus | 96.4 /100 | #93 | Exceptional 80.1% |
| Immigrants | Asia | 96.0 /100 | #94 | Exceptional 80.1% |
| Yugoslavians | 95.9 /100 | #95 | Exceptional 80.1% |
| Immigrants | Malaysia | 95.9 /100 | #96 | Exceptional 80.1% |
| South Americans | 95.9 /100 | #97 | Exceptional 80.1% |
| Immigrants | Uruguay | 95.8 /100 | #98 | Exceptional 80.1% |
| Immigrants | Chile | 95.7 /100 | #99 | Exceptional 80.1% |
| Filipinos | 95.6 /100 | #100 | Exceptional 80.1% |
| Palestinians | 95.5 /100 | #101 | Exceptional 80.0% |
| Immigrants | Australia | 95.5 /100 | #102 | Exceptional 80.0% |
| Russians | 95.5 /100 | #103 | Exceptional 80.0% |
| Venezuelans | 95.3 /100 | #104 | Exceptional 80.0% |
| Immigrants | Ghana | 95.0 /100 | #105 | Exceptional 80.0% |
| Greeks | 94.8 /100 | #106 | Exceptional 80.0% |
Demographics Similar to Macedonians by In Labor Force | Age 20-64
In terms of in labor force | age 20-64, the demographic groups most similar to Macedonians are Lithuanian (80.2%, a difference of 0.0%), Taiwanese (80.2%, a difference of 0.0%), Immigrants from Albania (80.3%, a difference of 0.010%), Bhutanese (80.2%, a difference of 0.010%), and Albanian (80.2%, a difference of 0.010%).
| Demographics | Rating | Rank | In Labor Force | Age 20-64 |
| Swedes | 98.9 /100 | #59 | Exceptional 80.3% |
| Tongans | 98.8 /100 | #60 | Exceptional 80.3% |
| Burmese | 98.8 /100 | #61 | Exceptional 80.3% |
| Carpatho Rusyns | 98.8 /100 | #62 | Exceptional 80.3% |
| Immigrants | Korea | 98.8 /100 | #63 | Exceptional 80.3% |
| Immigrants | Albania | 98.7 /100 | #64 | Exceptional 80.3% |
| Lithuanians | 98.7 /100 | #65 | Exceptional 80.2% |
| Macedonians | 98.7 /100 | #66 | Exceptional 80.2% |
| Taiwanese | 98.6 /100 | #67 | Exceptional 80.2% |
| Bhutanese | 98.6 /100 | #68 | Exceptional 80.2% |
| Albanians | 98.6 /100 | #69 | Exceptional 80.2% |
| Immigrants | Turkey | 98.5 /100 | #70 | Exceptional 80.2% |
| Soviet Union | 98.5 /100 | #71 | Exceptional 80.2% |
| Eastern Europeans | 98.4 /100 | #72 | Exceptional 80.2% |
| Cypriots | 98.2 /100 | #73 | Exceptional 80.2% |