Immigrants from Chile vs Immigrants from Africa In Labor Force | Age 25-29
COMPARE
Immigrants from Chile
Immigrants from Africa
In Labor Force | Age 25-29
In Labor Force | Age 25-29 Comparison
Immigrants from Chile
Immigrants from Africa
84.9%
IN LABOR FORCE | AGE 25-29
85.6/ 100
METRIC RATING
121st/ 347
METRIC RANK
85.2%
IN LABOR FORCE | AGE 25-29
96.7/ 100
METRIC RATING
85th/ 347
METRIC RANK
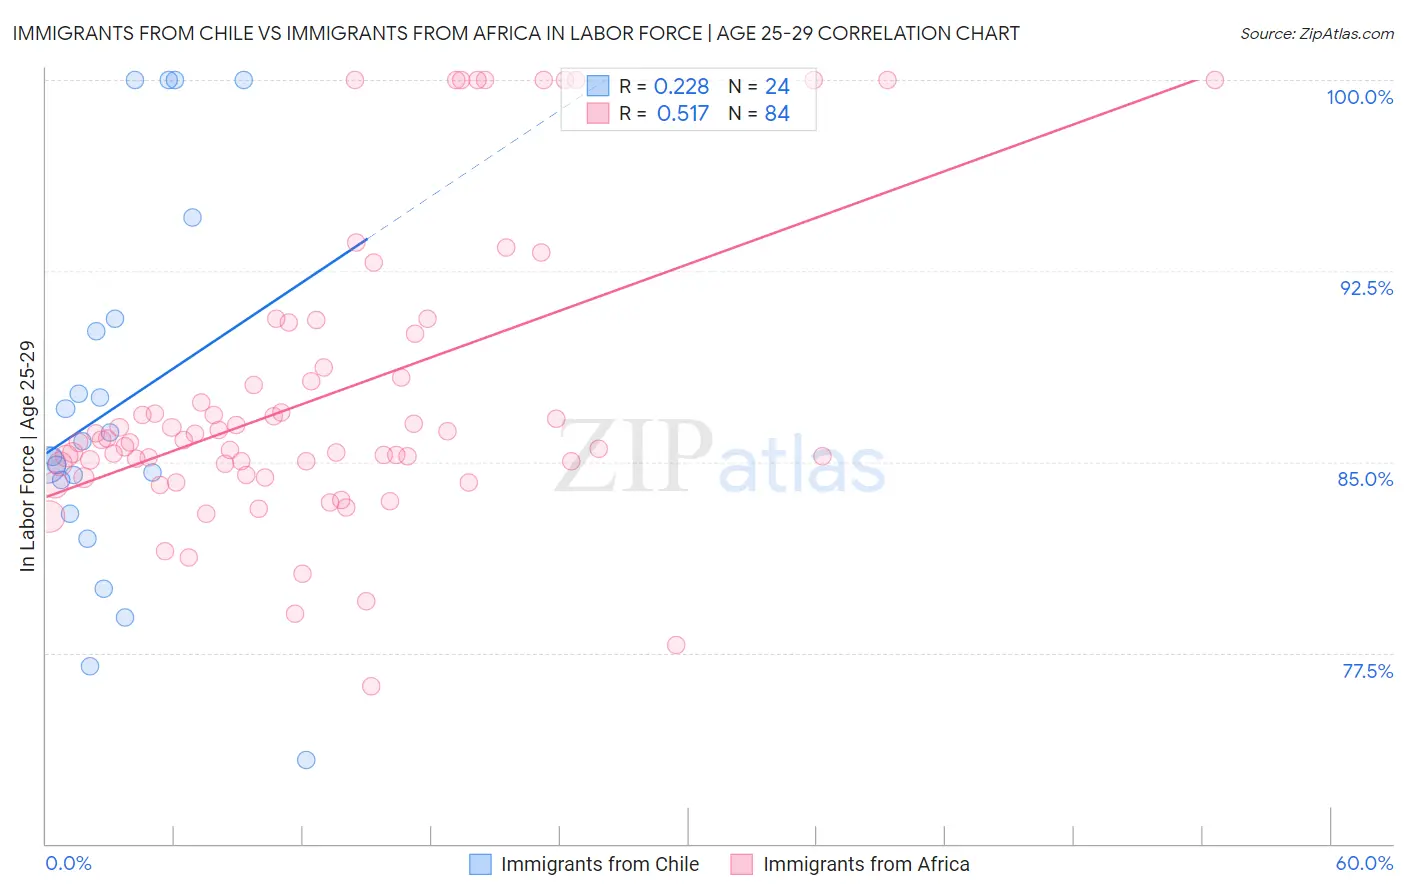
Immigrants from Chile vs Immigrants from Africa In Labor Force | Age 25-29 Correlation Chart
The statistical analysis conducted on geographies consisting of 218,609,496 people shows a weak positive correlation between the proportion of Immigrants from Chile and labor force participation rate among population between the ages 25 and 29 in the United States with a correlation coefficient (R) of 0.228 and weighted average of 84.9%. Similarly, the statistical analysis conducted on geographies consisting of 469,196,939 people shows a substantial positive correlation between the proportion of Immigrants from Africa and labor force participation rate among population between the ages 25 and 29 in the United States with a correlation coefficient (R) of 0.517 and weighted average of 85.2%, a difference of 0.29%.
In Labor Force | Age 25-29 Correlation Summary
| Measurement | Immigrants from Chile | Immigrants from Africa |
| Minimum | 73.3% | 76.2% |
| Maximum | 100.0% | 100.0% |
| Range | 26.7% | 23.8% |
| Mean | 87.2% | 87.5% |
| Median | 85.5% | 85.8% |
| Interquartile 25% (IQ1) | 83.6% | 84.7% |
| Interquartile 75% (IQ3) | 90.4% | 88.5% |
| Interquartile Range (IQR) | 6.7% | 3.8% |
| Standard Deviation (Sample) | 7.3% | 5.7% |
| Standard Deviation (Population) | 7.2% | 5.7% |
Similar Demographics by In Labor Force | Age 25-29
Demographics Similar to Immigrants from Chile by In Labor Force | Age 25-29
In terms of in labor force | age 25-29, the demographic groups most similar to Immigrants from Chile are Immigrants from South Africa (84.9%, a difference of 0.010%), Scandinavian (84.9%, a difference of 0.010%), Dutch (84.9%, a difference of 0.010%), Immigrants from Iran (84.9%, a difference of 0.010%), and Uruguayan (84.9%, a difference of 0.010%).
| Demographics | Rating | Rank | In Labor Force | Age 25-29 |
| Immigrants | Malaysia | 90.4 /100 | #114 | Exceptional 85.0% |
| South Africans | 88.9 /100 | #115 | Excellent 85.0% |
| Chileans | 88.8 /100 | #116 | Excellent 85.0% |
| Immigrants | Belarus | 88.0 /100 | #117 | Excellent 85.0% |
| Finns | 87.8 /100 | #118 | Excellent 85.0% |
| Filipinos | 87.1 /100 | #119 | Excellent 84.9% |
| Immigrants | South Africa | 86.1 /100 | #120 | Excellent 84.9% |
| Immigrants | Chile | 85.6 /100 | #121 | Excellent 84.9% |
| Scandinavians | 85.1 /100 | #122 | Excellent 84.9% |
| Dutch | 84.9 /100 | #123 | Excellent 84.9% |
| Immigrants | Iran | 84.8 /100 | #124 | Excellent 84.9% |
| Uruguayans | 84.7 /100 | #125 | Excellent 84.9% |
| Immigrants | Singapore | 84.4 /100 | #126 | Excellent 84.9% |
| Immigrants | Uruguay | 84.0 /100 | #127 | Excellent 84.9% |
| Australians | 83.6 /100 | #128 | Excellent 84.9% |
Demographics Similar to Immigrants from Africa by In Labor Force | Age 25-29
In terms of in labor force | age 25-29, the demographic groups most similar to Immigrants from Africa are Immigrants from Eastern Europe (85.2%, a difference of 0.0%), Ukrainian (85.2%, a difference of 0.0%), Okinawan (85.2%, a difference of 0.010%), Immigrants from Europe (85.2%, a difference of 0.010%), and French Canadian (85.2%, a difference of 0.010%).
| Demographics | Rating | Rank | In Labor Force | Age 25-29 |
| Immigrants | Egypt | 97.7 /100 | #78 | Exceptional 85.2% |
| Immigrants | Northern Africa | 97.6 /100 | #79 | Exceptional 85.2% |
| Immigrants | Zimbabwe | 97.6 /100 | #80 | Exceptional 85.2% |
| Immigrants | Northern Europe | 97.2 /100 | #81 | Exceptional 85.2% |
| Okinawans | 97.0 /100 | #82 | Exceptional 85.2% |
| Immigrants | Europe | 96.8 /100 | #83 | Exceptional 85.2% |
| Immigrants | Eastern Europe | 96.8 /100 | #84 | Exceptional 85.2% |
| Immigrants | Africa | 96.7 /100 | #85 | Exceptional 85.2% |
| Ukrainians | 96.7 /100 | #86 | Exceptional 85.2% |
| French Canadians | 96.5 /100 | #87 | Exceptional 85.2% |
| Immigrants | Croatia | 96.4 /100 | #88 | Exceptional 85.2% |
| Immigrants | France | 96.3 /100 | #89 | Exceptional 85.2% |
| Burmese | 95.9 /100 | #90 | Exceptional 85.1% |
| Immigrants | Moldova | 95.8 /100 | #91 | Exceptional 85.1% |
| Immigrants | Costa Rica | 95.5 /100 | #92 | Exceptional 85.1% |