Immigrants from Central America vs Pima In Labor Force | Age 20-64
COMPARE
Immigrants from Central America
Pima
In Labor Force | Age 20-64
In Labor Force | Age 20-64 Comparison
Immigrants from Central America
Pima
77.7%
IN LABOR FORCE | AGE 20-64
0.0/ 100
METRIC RATING
294th/ 347
METRIC RANK
69.0%
IN LABOR FORCE | AGE 20-64
0.0/ 100
METRIC RATING
347th/ 347
METRIC RANK
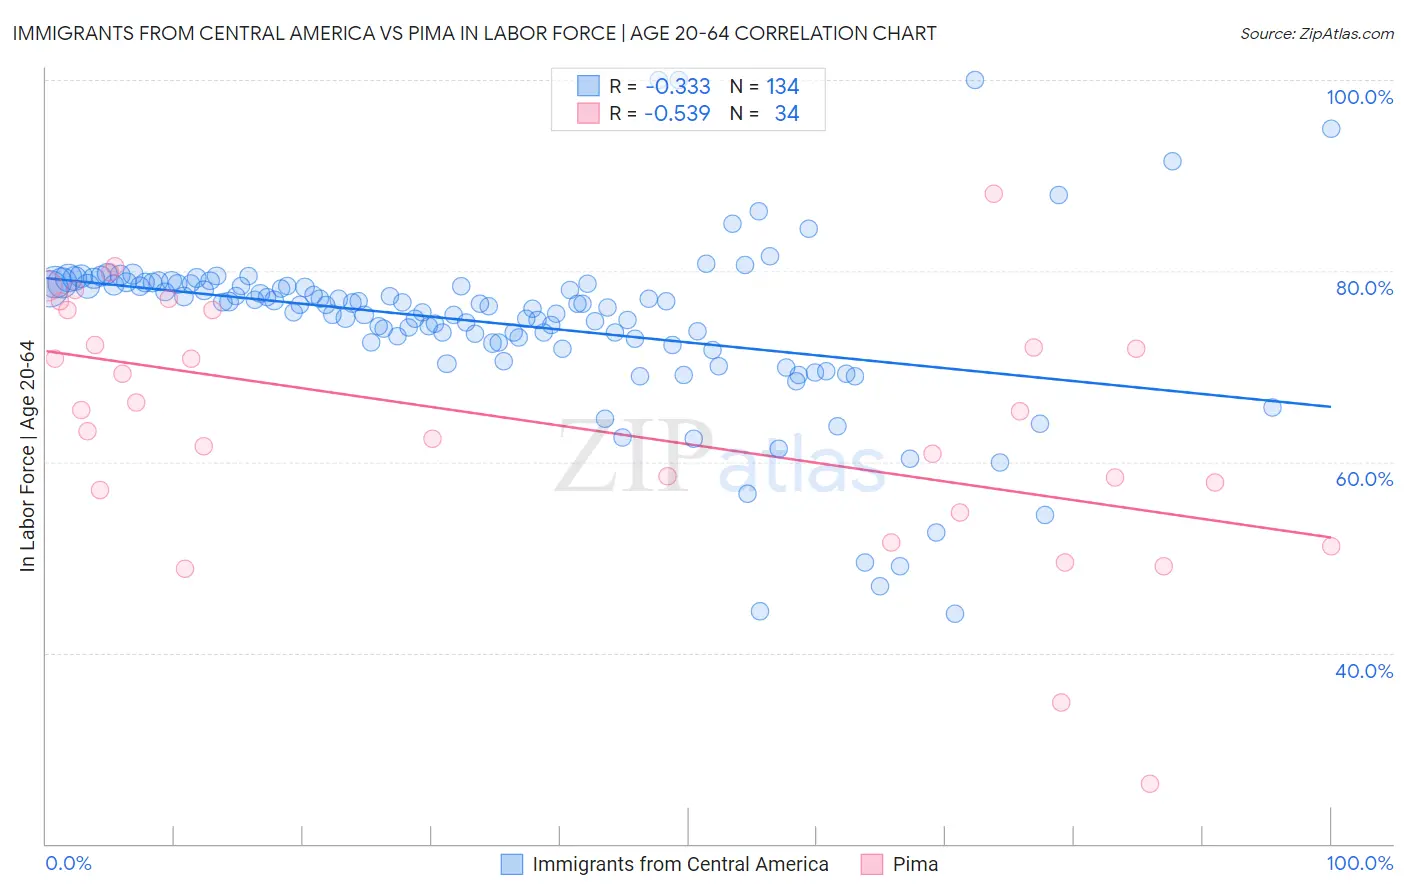
Immigrants from Central America vs Pima In Labor Force | Age 20-64 Correlation Chart
The statistical analysis conducted on geographies consisting of 536,506,208 people shows a mild negative correlation between the proportion of Immigrants from Central America and labor force participation rate among population between the ages 20 and 64 in the United States with a correlation coefficient (R) of -0.333 and weighted average of 77.7%. Similarly, the statistical analysis conducted on geographies consisting of 61,542,645 people shows a substantial negative correlation between the proportion of Pima and labor force participation rate among population between the ages 20 and 64 in the United States with a correlation coefficient (R) of -0.539 and weighted average of 69.0%, a difference of 12.6%.
In Labor Force | Age 20-64 Correlation Summary
| Measurement | Immigrants from Central America | Pima |
| Minimum | 44.1% | 26.3% |
| Maximum | 100.0% | 88.1% |
| Range | 55.9% | 61.8% |
| Mean | 74.5% | 64.1% |
| Median | 76.5% | 65.3% |
| Interquartile 25% (IQ1) | 72.5% | 57.1% |
| Interquartile 75% (IQ3) | 78.6% | 75.9% |
| Interquartile Range (IQR) | 6.1% | 18.8% |
| Standard Deviation (Sample) | 9.0% | 13.4% |
| Standard Deviation (Population) | 9.0% | 13.2% |
Similar Demographics by In Labor Force | Age 20-64
Demographics Similar to Immigrants from Central America by In Labor Force | Age 20-64
In terms of in labor force | age 20-64, the demographic groups most similar to Immigrants from Central America are Immigrants from Grenada (77.7%, a difference of 0.030%), Immigrants from Dominican Republic (77.7%, a difference of 0.070%), Dominican (77.7%, a difference of 0.070%), Cree (77.7%, a difference of 0.080%), and Delaware (77.8%, a difference of 0.090%).
| Demographics | Rating | Rank | In Labor Force | Age 20-64 |
| Vietnamese | 0.0 /100 | #287 | Tragic 78.0% |
| Hmong | 0.0 /100 | #288 | Tragic 77.9% |
| Africans | 0.0 /100 | #289 | Tragic 77.9% |
| Immigrants | Bangladesh | 0.0 /100 | #290 | Tragic 77.9% |
| Spanish Americans | 0.0 /100 | #291 | Tragic 77.8% |
| Immigrants | Azores | 0.0 /100 | #292 | Tragic 77.8% |
| Delaware | 0.0 /100 | #293 | Tragic 77.8% |
| Immigrants | Central America | 0.0 /100 | #294 | Tragic 77.7% |
| Immigrants | Grenada | 0.0 /100 | #295 | Tragic 77.7% |
| Immigrants | Dominican Republic | 0.0 /100 | #296 | Tragic 77.7% |
| Dominicans | 0.0 /100 | #297 | Tragic 77.7% |
| Cree | 0.0 /100 | #298 | Tragic 77.7% |
| Hispanics or Latinos | 0.0 /100 | #299 | Tragic 77.6% |
| Spanish American Indians | 0.0 /100 | #300 | Tragic 77.6% |
| Nepalese | 0.0 /100 | #301 | Tragic 77.5% |
Demographics Similar to Pima by In Labor Force | Age 20-64
In terms of in labor force | age 20-64, the demographic groups most similar to Pima are Navajo (69.2%, a difference of 0.16%), Tohono O'odham (70.4%, a difference of 2.0%), Lumbee (70.6%, a difference of 2.3%), Hopi (71.7%, a difference of 3.9%), and Yuman (71.7%, a difference of 3.9%).
| Demographics | Rating | Rank | In Labor Force | Age 20-64 |
| Natives/Alaskans | 0.0 /100 | #333 | Tragic 73.9% |
| Apache | 0.0 /100 | #334 | Tragic 73.7% |
| Ute | 0.0 /100 | #335 | Tragic 73.7% |
| Crow | 0.0 /100 | #336 | Tragic 73.3% |
| Yup'ik | 0.0 /100 | #337 | Tragic 73.2% |
| Puerto Ricans | 0.0 /100 | #338 | Tragic 73.1% |
| Houma | 0.0 /100 | #339 | Tragic 72.7% |
| Pueblo | 0.0 /100 | #340 | Tragic 72.6% |
| Immigrants | Yemen | 0.0 /100 | #341 | Tragic 72.3% |
| Yuman | 0.0 /100 | #342 | Tragic 71.7% |
| Hopi | 0.0 /100 | #343 | Tragic 71.7% |
| Lumbee | 0.0 /100 | #344 | Tragic 70.6% |
| Tohono O'odham | 0.0 /100 | #345 | Tragic 70.4% |
| Navajo | 0.0 /100 | #346 | Tragic 69.2% |
| Pima | 0.0 /100 | #347 | Tragic 69.0% |