Immigrants from Central America vs Pima Currently Married
COMPARE
Immigrants from Central America
Pima
Currently Married
Currently Married Comparison
Immigrants from Central America
Pima
44.1%
CURRENTLY MARRIED
0.3/ 100
METRIC RATING
253rd/ 347
METRIC RANK
35.9%
CURRENTLY MARRIED
0.0/ 100
METRIC RATING
347th/ 347
METRIC RANK
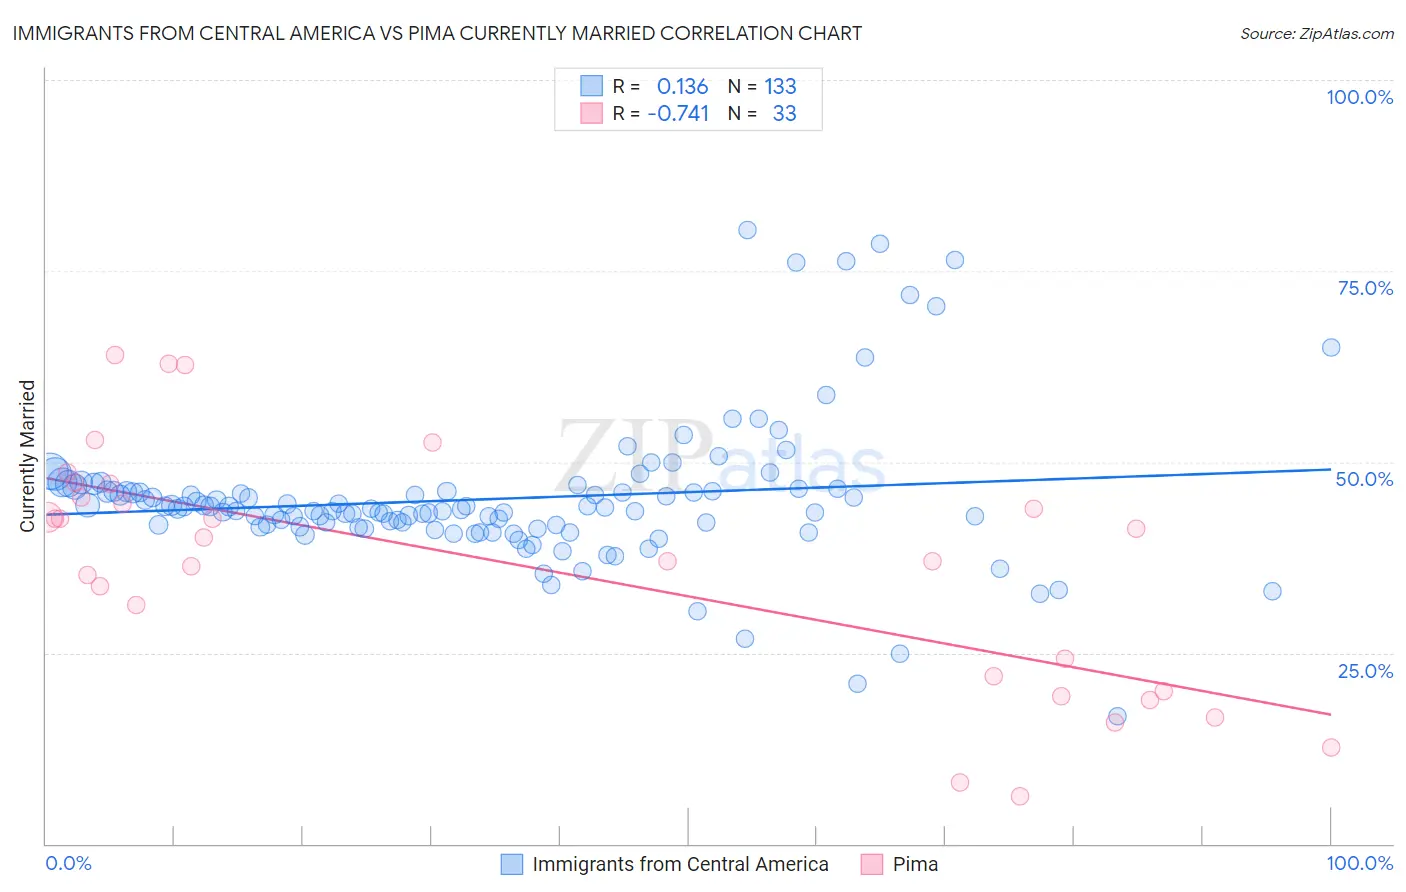
Immigrants from Central America vs Pima Currently Married Correlation Chart
The statistical analysis conducted on geographies consisting of 536,454,573 people shows a poor positive correlation between the proportion of Immigrants from Central America and percentage of population currently married in the United States with a correlation coefficient (R) of 0.136 and weighted average of 44.1%. Similarly, the statistical analysis conducted on geographies consisting of 61,552,342 people shows a strong negative correlation between the proportion of Pima and percentage of population currently married in the United States with a correlation coefficient (R) of -0.741 and weighted average of 35.9%, a difference of 22.9%.
Currently Married Correlation Summary
| Measurement | Immigrants from Central America | Pima |
| Minimum | 16.7% | 6.2% |
| Maximum | 80.4% | 64.0% |
| Range | 63.7% | 57.8% |
| Mean | 45.1% | 36.3% |
| Median | 43.8% | 40.1% |
| Interquartile 25% (IQ1) | 41.5% | 21.0% |
| Interquartile 75% (IQ3) | 46.2% | 46.2% |
| Interquartile Range (IQR) | 4.7% | 25.2% |
| Standard Deviation (Sample) | 9.6% | 15.6% |
| Standard Deviation (Population) | 9.5% | 15.4% |
Similar Demographics by Currently Married
Demographics Similar to Immigrants from Central America by Currently Married
In terms of currently married, the demographic groups most similar to Immigrants from Central America are Hispanic or Latino (44.1%, a difference of 0.030%), Blackfeet (44.2%, a difference of 0.050%), Immigrants from Eastern Africa (44.2%, a difference of 0.12%), Immigrants from Cameroon (44.2%, a difference of 0.14%), and Nicaraguan (44.2%, a difference of 0.15%).
| Demographics | Rating | Rank | Currently Married |
| Immigrants | Burma/Myanmar | 0.4 /100 | #246 | Tragic 44.3% |
| Ugandans | 0.4 /100 | #247 | Tragic 44.2% |
| Nicaraguans | 0.3 /100 | #248 | Tragic 44.2% |
| Immigrants | Cameroon | 0.3 /100 | #249 | Tragic 44.2% |
| Immigrants | Eastern Africa | 0.3 /100 | #250 | Tragic 44.2% |
| Blackfeet | 0.3 /100 | #251 | Tragic 44.2% |
| Hispanics or Latinos | 0.3 /100 | #252 | Tragic 44.1% |
| Immigrants | Central America | 0.3 /100 | #253 | Tragic 44.1% |
| Vietnamese | 0.2 /100 | #254 | Tragic 44.0% |
| Yakama | 0.2 /100 | #255 | Tragic 44.0% |
| Shoshone | 0.2 /100 | #256 | Tragic 44.0% |
| Immigrants | Africa | 0.2 /100 | #257 | Tragic 43.9% |
| Ute | 0.2 /100 | #258 | Tragic 43.9% |
| Immigrants | Sierra Leone | 0.1 /100 | #259 | Tragic 43.8% |
| Immigrants | Latin America | 0.1 /100 | #260 | Tragic 43.8% |
Demographics Similar to Pima by Currently Married
In terms of currently married, the demographic groups most similar to Pima are Hopi (36.5%, a difference of 1.8%), Tohono O'odham (36.8%, a difference of 2.4%), Immigrants from Cabo Verde (37.8%, a difference of 5.4%), Pueblo (38.2%, a difference of 6.5%), and Immigrants from Dominican Republic (38.9%, a difference of 8.4%).
| Demographics | Rating | Rank | Currently Married |
| Yup'ik | 0.0 /100 | #333 | Tragic 39.9% |
| Puerto Ricans | 0.0 /100 | #334 | Tragic 39.9% |
| Lumbee | 0.0 /100 | #335 | Tragic 39.8% |
| British West Indians | 0.0 /100 | #336 | Tragic 39.8% |
| Blacks/African Americans | 0.0 /100 | #337 | Tragic 39.6% |
| Cape Verdeans | 0.0 /100 | #338 | Tragic 39.6% |
| Dominicans | 0.0 /100 | #339 | Tragic 39.5% |
| Immigrants | Grenada | 0.0 /100 | #340 | Tragic 39.1% |
| Navajo | 0.0 /100 | #341 | Tragic 39.0% |
| Immigrants | Dominican Republic | 0.0 /100 | #342 | Tragic 38.9% |
| Pueblo | 0.0 /100 | #343 | Tragic 38.2% |
| Immigrants | Cabo Verde | 0.0 /100 | #344 | Tragic 37.8% |
| Tohono O'odham | 0.0 /100 | #345 | Tragic 36.8% |
| Hopi | 0.0 /100 | #346 | Tragic 36.5% |
| Pima | 0.0 /100 | #347 | Tragic 35.9% |