Immigrants from Uruguay vs Native/Alaskan In Labor Force | Age 25-29
COMPARE
Immigrants from Uruguay
Native/Alaskan
In Labor Force | Age 25-29
In Labor Force | Age 25-29 Comparison
Immigrants from Uruguay
Natives/Alaskans
84.9%
IN LABOR FORCE | AGE 25-29
84.0/ 100
METRIC RATING
127th/ 347
METRIC RANK
79.3%
IN LABOR FORCE | AGE 25-29
0.0/ 100
METRIC RATING
335th/ 347
METRIC RANK
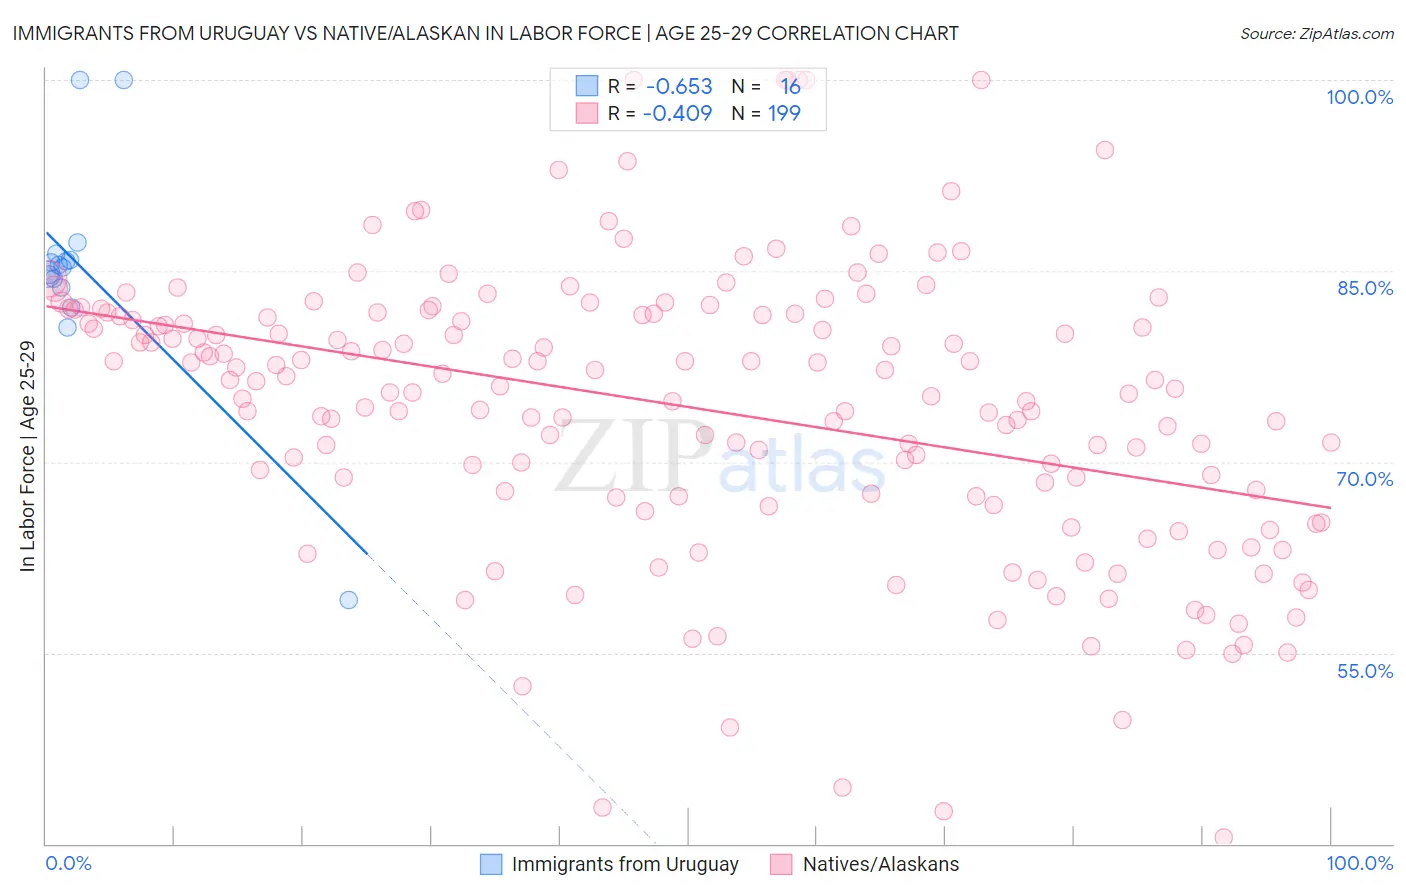
Immigrants from Uruguay vs Native/Alaskan In Labor Force | Age 25-29 Correlation Chart
The statistical analysis conducted on geographies consisting of 133,247,339 people shows a significant negative correlation between the proportion of Immigrants from Uruguay and labor force participation rate among population between the ages 25 and 29 in the United States with a correlation coefficient (R) of -0.653 and weighted average of 84.9%. Similarly, the statistical analysis conducted on geographies consisting of 512,496,392 people shows a moderate negative correlation between the proportion of Natives/Alaskans and labor force participation rate among population between the ages 25 and 29 in the United States with a correlation coefficient (R) of -0.409 and weighted average of 79.3%, a difference of 7.1%.
In Labor Force | Age 25-29 Correlation Summary
| Measurement | Immigrants from Uruguay | Native/Alaskan |
| Minimum | 59.1% | 40.5% |
| Maximum | 100.0% | 100.0% |
| Range | 40.9% | 59.5% |
| Mean | 85.1% | 74.3% |
| Median | 85.3% | 76.3% |
| Interquartile 25% (IQ1) | 84.0% | 67.3% |
| Interquartile 75% (IQ3) | 86.1% | 81.6% |
| Interquartile Range (IQR) | 2.1% | 14.3% |
| Standard Deviation (Sample) | 8.8% | 11.3% |
| Standard Deviation (Population) | 8.5% | 11.2% |
Similar Demographics by In Labor Force | Age 25-29
Demographics Similar to Immigrants from Uruguay by In Labor Force | Age 25-29
In terms of in labor force | age 25-29, the demographic groups most similar to Immigrants from Uruguay are Dutch (84.9%, a difference of 0.010%), Immigrants from Iran (84.9%, a difference of 0.010%), Uruguayan (84.9%, a difference of 0.010%), Immigrants from Singapore (84.9%, a difference of 0.010%), and Australian (84.9%, a difference of 0.010%).
| Demographics | Rating | Rank | In Labor Force | Age 25-29 |
| Immigrants | South Africa | 86.1 /100 | #120 | Excellent 84.9% |
| Immigrants | Chile | 85.6 /100 | #121 | Excellent 84.9% |
| Scandinavians | 85.1 /100 | #122 | Excellent 84.9% |
| Dutch | 84.9 /100 | #123 | Excellent 84.9% |
| Immigrants | Iran | 84.8 /100 | #124 | Excellent 84.9% |
| Uruguayans | 84.7 /100 | #125 | Excellent 84.9% |
| Immigrants | Singapore | 84.4 /100 | #126 | Excellent 84.9% |
| Immigrants | Uruguay | 84.0 /100 | #127 | Excellent 84.9% |
| Australians | 83.6 /100 | #128 | Excellent 84.9% |
| Immigrants | Russia | 81.6 /100 | #129 | Excellent 84.9% |
| Northern Europeans | 81.3 /100 | #130 | Excellent 84.9% |
| Iranians | 78.1 /100 | #131 | Good 84.8% |
| Romanians | 77.7 /100 | #132 | Good 84.8% |
| Asians | 77.7 /100 | #133 | Good 84.8% |
| Syrians | 76.5 /100 | #134 | Good 84.8% |
Demographics Similar to Natives/Alaskans by In Labor Force | Age 25-29
In terms of in labor force | age 25-29, the demographic groups most similar to Natives/Alaskans are Apache (79.2%, a difference of 0.070%), Yuman (79.3%, a difference of 0.080%), Sioux (79.7%, a difference of 0.50%), Inupiat (79.8%, a difference of 0.61%), and Crow (78.6%, a difference of 0.83%).
| Demographics | Rating | Rank | In Labor Force | Age 25-29 |
| Creek | 0.0 /100 | #328 | Tragic 80.7% |
| Yakama | 0.0 /100 | #329 | Tragic 80.6% |
| Puerto Ricans | 0.0 /100 | #330 | Tragic 80.4% |
| Cheyenne | 0.0 /100 | #331 | Tragic 80.3% |
| Inupiat | 0.0 /100 | #332 | Tragic 79.8% |
| Sioux | 0.0 /100 | #333 | Tragic 79.7% |
| Yuman | 0.0 /100 | #334 | Tragic 79.3% |
| Natives/Alaskans | 0.0 /100 | #335 | Tragic 79.3% |
| Apache | 0.0 /100 | #336 | Tragic 79.2% |
| Crow | 0.0 /100 | #337 | Tragic 78.6% |
| Lumbee | 0.0 /100 | #338 | Tragic 78.3% |
| Immigrants | Yemen | 0.0 /100 | #339 | Tragic 78.2% |
| Paiute | 0.0 /100 | #340 | Tragic 78.1% |
| Tohono O'odham | 0.0 /100 | #341 | Tragic 77.5% |
| Pueblo | 0.0 /100 | #342 | Tragic 77.5% |