Immigrants from Cameroon vs Immigrants from Korea In Labor Force | Age 20-24
COMPARE
Immigrants from Cameroon
Immigrants from Korea
In Labor Force | Age 20-24
In Labor Force | Age 20-24 Comparison
Immigrants from Cameroon
Immigrants from Korea
76.6%
IN LABOR FORCE | AGE 20-24
99.6/ 100
METRIC RATING
77th/ 347
METRIC RANK
73.1%
IN LABOR FORCE | AGE 20-24
0.1/ 100
METRIC RATING
287th/ 347
METRIC RANK
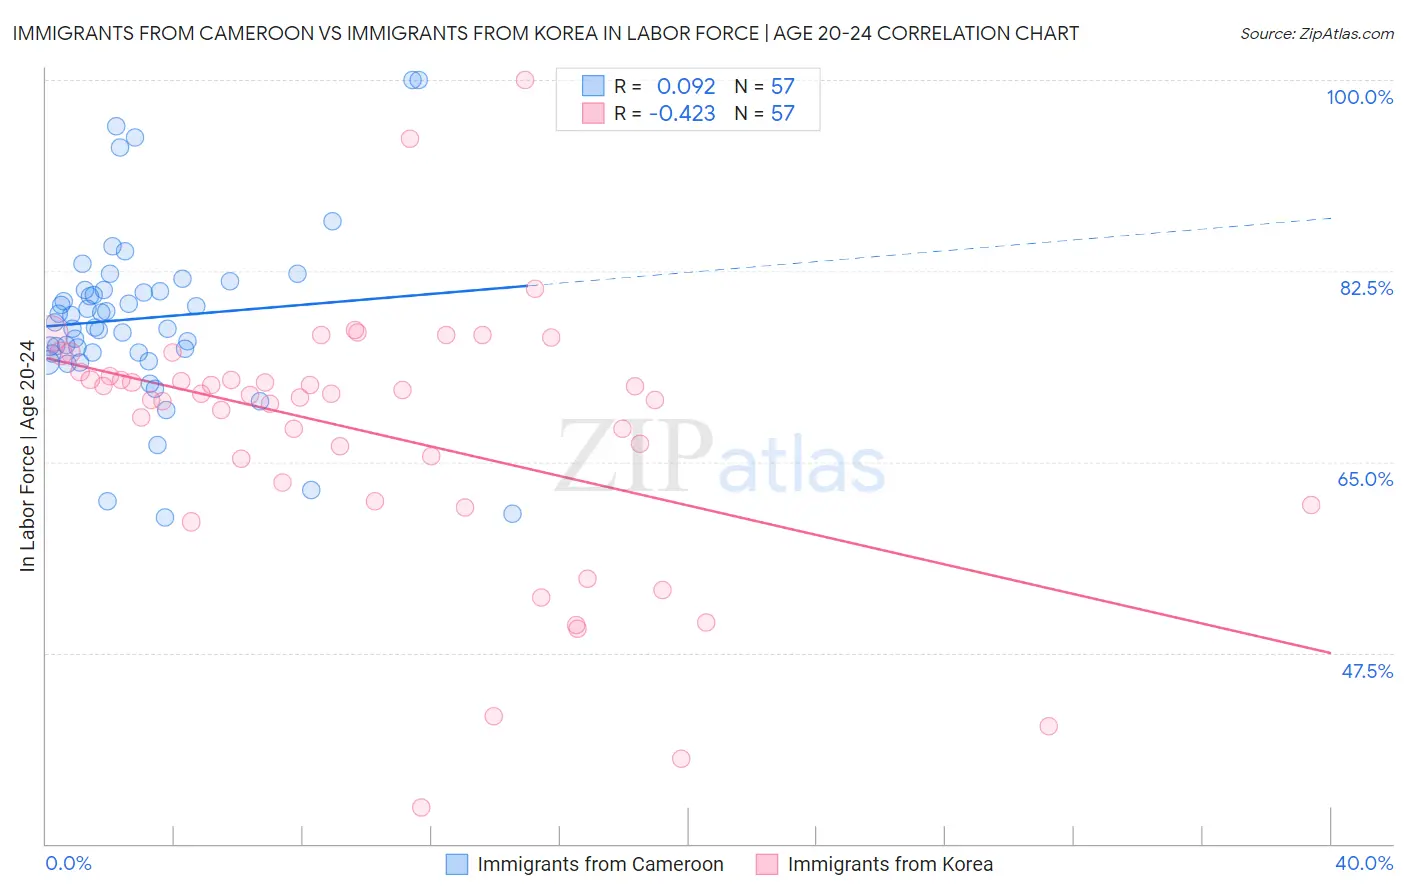
Immigrants from Cameroon vs Immigrants from Korea In Labor Force | Age 20-24 Correlation Chart
The statistical analysis conducted on geographies consisting of 130,759,306 people shows a slight positive correlation between the proportion of Immigrants from Cameroon and labor force participation rate among population between the ages 20 and 24 in the United States with a correlation coefficient (R) of 0.092 and weighted average of 76.6%. Similarly, the statistical analysis conducted on geographies consisting of 416,204,507 people shows a moderate negative correlation between the proportion of Immigrants from Korea and labor force participation rate among population between the ages 20 and 24 in the United States with a correlation coefficient (R) of -0.423 and weighted average of 73.1%, a difference of 4.7%.
In Labor Force | Age 20-24 Correlation Summary
| Measurement | Immigrants from Cameroon | Immigrants from Korea |
| Minimum | 59.9% | 33.3% |
| Maximum | 100.0% | 100.0% |
| Range | 40.1% | 66.7% |
| Mean | 78.2% | 67.6% |
| Median | 77.8% | 71.1% |
| Interquartile 25% (IQ1) | 75.0% | 62.2% |
| Interquartile 75% (IQ3) | 80.7% | 73.1% |
| Interquartile Range (IQR) | 5.8% | 10.8% |
| Standard Deviation (Sample) | 8.2% | 12.2% |
| Standard Deviation (Population) | 8.1% | 12.1% |
Similar Demographics by In Labor Force | Age 20-24
Demographics Similar to Immigrants from Cameroon by In Labor Force | Age 20-24
In terms of in labor force | age 20-24, the demographic groups most similar to Immigrants from Cameroon are Canadian (76.6%, a difference of 0.0%), Immigrants from Zaire (76.6%, a difference of 0.020%), Immigrants from Moldova (76.6%, a difference of 0.030%), Italian (76.5%, a difference of 0.050%), and Immigrants from Middle Africa (76.6%, a difference of 0.070%).
| Demographics | Rating | Rank | In Labor Force | Age 20-24 |
| Ottawa | 99.8 /100 | #70 | Exceptional 76.8% |
| Northern Europeans | 99.8 /100 | #71 | Exceptional 76.8% |
| Guamanians/Chamorros | 99.8 /100 | #72 | Exceptional 76.7% |
| British | 99.8 /100 | #73 | Exceptional 76.7% |
| Cree | 99.7 /100 | #74 | Exceptional 76.6% |
| Immigrants | Middle Africa | 99.7 /100 | #75 | Exceptional 76.6% |
| Immigrants | Moldova | 99.6 /100 | #76 | Exceptional 76.6% |
| Immigrants | Cameroon | 99.6 /100 | #77 | Exceptional 76.6% |
| Canadians | 99.6 /100 | #78 | Exceptional 76.6% |
| Immigrants | Zaire | 99.6 /100 | #79 | Exceptional 76.6% |
| Italians | 99.6 /100 | #80 | Exceptional 76.5% |
| Basques | 99.5 /100 | #81 | Exceptional 76.5% |
| Hmong | 99.5 /100 | #82 | Exceptional 76.5% |
| Carpatho Rusyns | 99.4 /100 | #83 | Exceptional 76.5% |
| Austrians | 99.4 /100 | #84 | Exceptional 76.5% |
Demographics Similar to Immigrants from Korea by In Labor Force | Age 20-24
In terms of in labor force | age 20-24, the demographic groups most similar to Immigrants from Korea are Immigrants from Lebanon (73.1%, a difference of 0.020%), Nicaraguan (73.2%, a difference of 0.050%), Argentinean (73.1%, a difference of 0.080%), Kiowa (73.2%, a difference of 0.11%), and U.S. Virgin Islander (73.0%, a difference of 0.11%).
| Demographics | Rating | Rank | In Labor Force | Age 20-24 |
| Bahamians | 0.1 /100 | #280 | Tragic 73.3% |
| Immigrants | Venezuela | 0.1 /100 | #281 | Tragic 73.2% |
| Immigrants | Spain | 0.1 /100 | #282 | Tragic 73.2% |
| Immigrants | Bahamas | 0.1 /100 | #283 | Tragic 73.2% |
| Kiowa | 0.1 /100 | #284 | Tragic 73.2% |
| Nicaraguans | 0.1 /100 | #285 | Tragic 73.2% |
| Immigrants | Lebanon | 0.1 /100 | #286 | Tragic 73.1% |
| Immigrants | Korea | 0.1 /100 | #287 | Tragic 73.1% |
| Argentineans | 0.1 /100 | #288 | Tragic 73.1% |
| U.S. Virgin Islanders | 0.1 /100 | #289 | Tragic 73.0% |
| Immigrants | Belarus | 0.1 /100 | #290 | Tragic 73.0% |
| Immigrants | Nicaragua | 0.0 /100 | #291 | Tragic 72.9% |
| Pueblo | 0.0 /100 | #292 | Tragic 72.9% |
| Immigrants | Belize | 0.0 /100 | #293 | Tragic 72.8% |
| Immigrants | Argentina | 0.0 /100 | #294 | Tragic 72.8% |