Immigrants from Cambodia vs Turkish In Labor Force | Age 35-44
COMPARE
Immigrants from Cambodia
Turkish
In Labor Force | Age 35-44
In Labor Force | Age 35-44 Comparison
Immigrants from Cambodia
Turks
83.8%
IN LABOR FORCE | AGE 35-44
1.1/ 100
METRIC RATING
242nd/ 347
METRIC RANK
85.1%
IN LABOR FORCE | AGE 35-44
99.5/ 100
METRIC RATING
54th/ 347
METRIC RANK
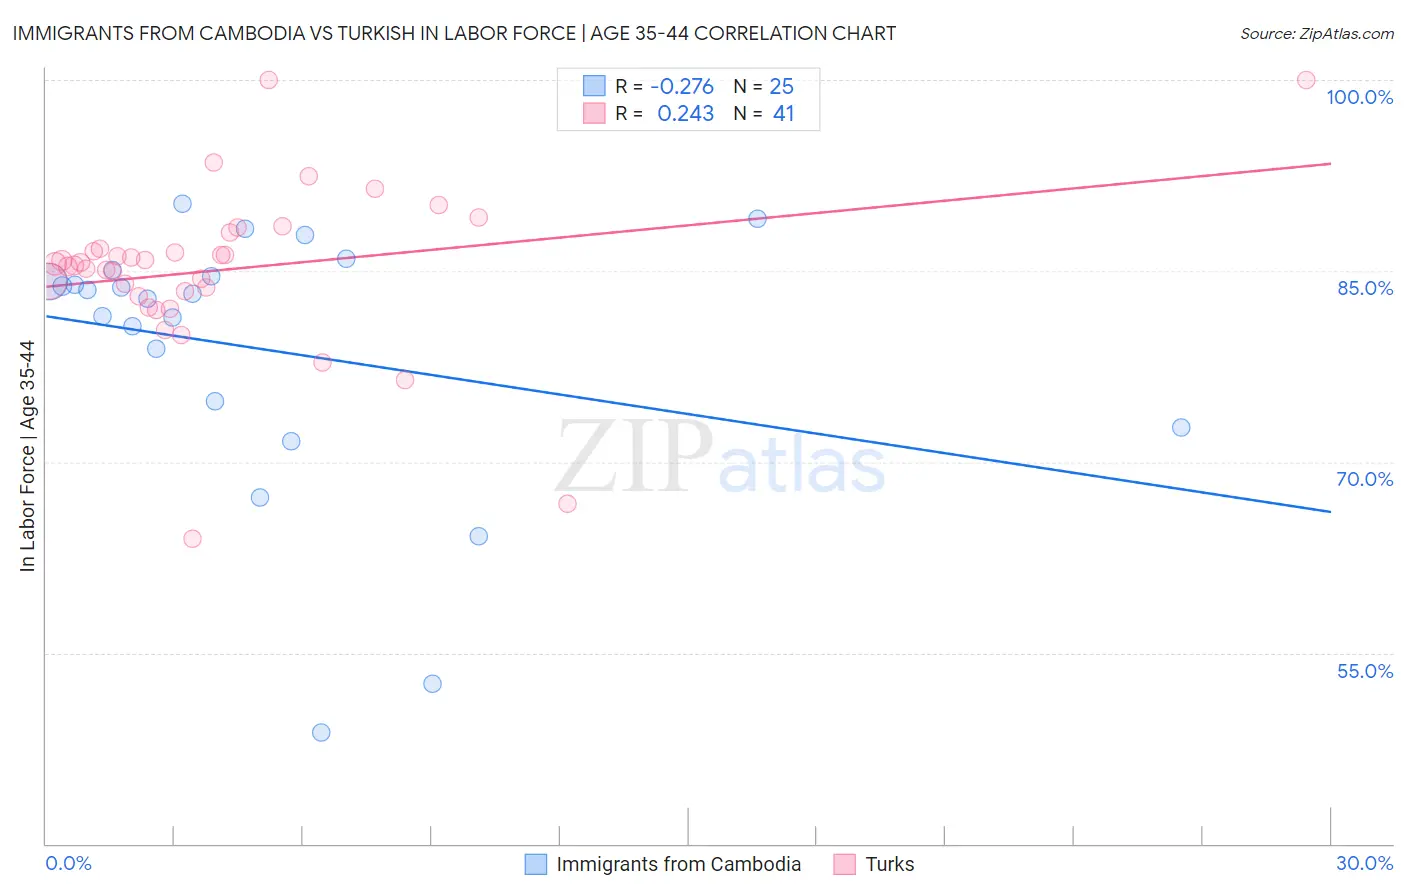
Immigrants from Cambodia vs Turkish In Labor Force | Age 35-44 Correlation Chart
The statistical analysis conducted on geographies consisting of 205,131,039 people shows a weak negative correlation between the proportion of Immigrants from Cambodia and labor force participation rate among population between the ages 35 and 44 in the United States with a correlation coefficient (R) of -0.276 and weighted average of 83.8%. Similarly, the statistical analysis conducted on geographies consisting of 271,726,396 people shows a weak positive correlation between the proportion of Turks and labor force participation rate among population between the ages 35 and 44 in the United States with a correlation coefficient (R) of 0.243 and weighted average of 85.1%, a difference of 1.6%.
In Labor Force | Age 35-44 Correlation Summary
| Measurement | Immigrants from Cambodia | Turkish |
| Minimum | 48.7% | 64.0% |
| Maximum | 90.3% | 100.0% |
| Range | 41.6% | 36.0% |
| Mean | 78.8% | 85.1% |
| Median | 83.2% | 85.5% |
| Interquartile 25% (IQ1) | 73.7% | 83.2% |
| Interquartile 75% (IQ3) | 84.8% | 87.4% |
| Interquartile Range (IQR) | 11.1% | 4.2% |
| Standard Deviation (Sample) | 10.7% | 6.5% |
| Standard Deviation (Population) | 10.5% | 6.4% |
Similar Demographics by In Labor Force | Age 35-44
Demographics Similar to Immigrants from Cambodia by In Labor Force | Age 35-44
In terms of in labor force | age 35-44, the demographic groups most similar to Immigrants from Cambodia are Immigrants from Western Asia (83.8%, a difference of 0.0%), Guyanese (83.8%, a difference of 0.010%), Malaysian (83.8%, a difference of 0.010%), Iraqi (83.8%, a difference of 0.020%), and Immigrants (83.7%, a difference of 0.020%).
| Demographics | Rating | Rank | In Labor Force | Age 35-44 |
| Immigrants | Syria | 2.5 /100 | #235 | Tragic 83.9% |
| West Indians | 2.4 /100 | #236 | Tragic 83.9% |
| English | 1.8 /100 | #237 | Tragic 83.8% |
| Immigrants | Laos | 1.7 /100 | #238 | Tragic 83.8% |
| Celtics | 1.4 /100 | #239 | Tragic 83.8% |
| Arabs | 1.3 /100 | #240 | Tragic 83.8% |
| Iraqis | 1.3 /100 | #241 | Tragic 83.8% |
| Immigrants | Cambodia | 1.1 /100 | #242 | Tragic 83.8% |
| Immigrants | Western Asia | 1.1 /100 | #243 | Tragic 83.8% |
| Guyanese | 1.1 /100 | #244 | Tragic 83.8% |
| Malaysians | 1.1 /100 | #245 | Tragic 83.8% |
| Immigrants | Immigrants | 1.0 /100 | #246 | Tragic 83.7% |
| Immigrants | Armenia | 0.9 /100 | #247 | Tragic 83.7% |
| Indonesians | 0.8 /100 | #248 | Tragic 83.7% |
| Immigrants | St. Vincent and the Grenadines | 0.7 /100 | #249 | Tragic 83.7% |
Demographics Similar to Turks by In Labor Force | Age 35-44
In terms of in labor force | age 35-44, the demographic groups most similar to Turks are Soviet Union (85.1%, a difference of 0.0%), Immigrants from Croatia (85.1%, a difference of 0.010%), Taiwanese (85.1%, a difference of 0.020%), Immigrants from Kenya (85.1%, a difference of 0.030%), and Chinese (85.1%, a difference of 0.030%).
| Demographics | Rating | Rank | In Labor Force | Age 35-44 |
| German Russians | 99.8 /100 | #47 | Exceptional 85.2% |
| Immigrants | Eritrea | 99.7 /100 | #48 | Exceptional 85.2% |
| Croatians | 99.7 /100 | #49 | Exceptional 85.2% |
| Thais | 99.7 /100 | #50 | Exceptional 85.2% |
| Immigrants | Albania | 99.7 /100 | #51 | Exceptional 85.1% |
| Immigrants | Kenya | 99.6 /100 | #52 | Exceptional 85.1% |
| Taiwanese | 99.6 /100 | #53 | Exceptional 85.1% |
| Turks | 99.5 /100 | #54 | Exceptional 85.1% |
| Soviet Union | 99.5 /100 | #55 | Exceptional 85.1% |
| Immigrants | Croatia | 99.5 /100 | #56 | Exceptional 85.1% |
| Chinese | 99.4 /100 | #57 | Exceptional 85.1% |
| Slovaks | 99.4 /100 | #58 | Exceptional 85.1% |
| Serbians | 99.4 /100 | #59 | Exceptional 85.1% |
| Albanians | 99.4 /100 | #60 | Exceptional 85.1% |
| Immigrants | Latvia | 99.3 /100 | #61 | Exceptional 85.0% |