Immigrants from Cambodia vs Immigrants from Singapore In Labor Force | Age 35-44
COMPARE
Immigrants from Cambodia
Immigrants from Singapore
In Labor Force | Age 35-44
In Labor Force | Age 35-44 Comparison
Immigrants from Cambodia
Immigrants from Singapore
83.8%
IN LABOR FORCE | AGE 35-44
1.1/ 100
METRIC RATING
242nd/ 347
METRIC RANK
85.0%
IN LABOR FORCE | AGE 35-44
98.9/ 100
METRIC RATING
72nd/ 347
METRIC RANK
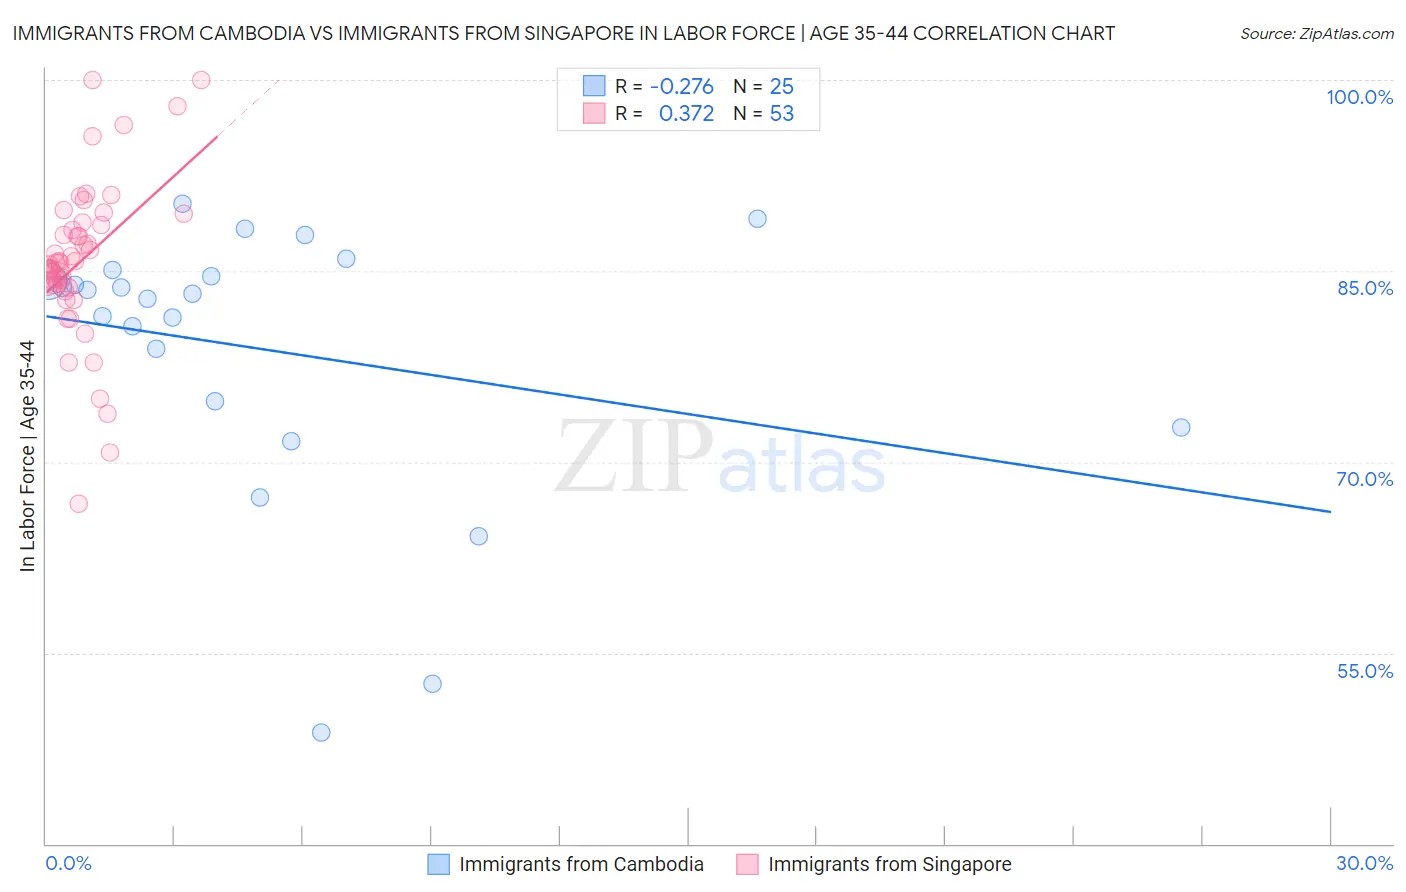
Immigrants from Cambodia vs Immigrants from Singapore In Labor Force | Age 35-44 Correlation Chart
The statistical analysis conducted on geographies consisting of 205,131,039 people shows a weak negative correlation between the proportion of Immigrants from Cambodia and labor force participation rate among population between the ages 35 and 44 in the United States with a correlation coefficient (R) of -0.276 and weighted average of 83.8%. Similarly, the statistical analysis conducted on geographies consisting of 137,454,935 people shows a mild positive correlation between the proportion of Immigrants from Singapore and labor force participation rate among population between the ages 35 and 44 in the United States with a correlation coefficient (R) of 0.372 and weighted average of 85.0%, a difference of 1.5%.
In Labor Force | Age 35-44 Correlation Summary
| Measurement | Immigrants from Cambodia | Immigrants from Singapore |
| Minimum | 48.7% | 66.7% |
| Maximum | 90.3% | 100.0% |
| Range | 41.6% | 33.3% |
| Mean | 78.8% | 85.7% |
| Median | 83.2% | 85.7% |
| Interquartile 25% (IQ1) | 73.7% | 83.8% |
| Interquartile 75% (IQ3) | 84.8% | 88.7% |
| Interquartile Range (IQR) | 11.1% | 4.9% |
| Standard Deviation (Sample) | 10.7% | 6.3% |
| Standard Deviation (Population) | 10.5% | 6.2% |
Similar Demographics by In Labor Force | Age 35-44
Demographics Similar to Immigrants from Cambodia by In Labor Force | Age 35-44
In terms of in labor force | age 35-44, the demographic groups most similar to Immigrants from Cambodia are Immigrants from Western Asia (83.8%, a difference of 0.0%), Guyanese (83.8%, a difference of 0.010%), Malaysian (83.8%, a difference of 0.010%), Iraqi (83.8%, a difference of 0.020%), and Immigrants (83.7%, a difference of 0.020%).
| Demographics | Rating | Rank | In Labor Force | Age 35-44 |
| Immigrants | Syria | 2.5 /100 | #235 | Tragic 83.9% |
| West Indians | 2.4 /100 | #236 | Tragic 83.9% |
| English | 1.8 /100 | #237 | Tragic 83.8% |
| Immigrants | Laos | 1.7 /100 | #238 | Tragic 83.8% |
| Celtics | 1.4 /100 | #239 | Tragic 83.8% |
| Arabs | 1.3 /100 | #240 | Tragic 83.8% |
| Iraqis | 1.3 /100 | #241 | Tragic 83.8% |
| Immigrants | Cambodia | 1.1 /100 | #242 | Tragic 83.8% |
| Immigrants | Western Asia | 1.1 /100 | #243 | Tragic 83.8% |
| Guyanese | 1.1 /100 | #244 | Tragic 83.8% |
| Malaysians | 1.1 /100 | #245 | Tragic 83.8% |
| Immigrants | Immigrants | 1.0 /100 | #246 | Tragic 83.7% |
| Immigrants | Armenia | 0.9 /100 | #247 | Tragic 83.7% |
| Indonesians | 0.8 /100 | #248 | Tragic 83.7% |
| Immigrants | St. Vincent and the Grenadines | 0.7 /100 | #249 | Tragic 83.7% |
Demographics Similar to Immigrants from Singapore by In Labor Force | Age 35-44
In terms of in labor force | age 35-44, the demographic groups most similar to Immigrants from Singapore are Immigrants from Sri Lanka (85.0%, a difference of 0.0%), Colombian (85.0%, a difference of 0.010%), Brazilian (85.0%, a difference of 0.020%), Russian (85.0%, a difference of 0.020%), and Immigrants from South Central Asia (85.0%, a difference of 0.020%).
| Demographics | Rating | Rank | In Labor Force | Age 35-44 |
| Immigrants | Brazil | 99.2 /100 | #65 | Exceptional 85.0% |
| Immigrants | Haiti | 99.1 /100 | #66 | Exceptional 85.0% |
| Immigrants | Italy | 99.1 /100 | #67 | Exceptional 85.0% |
| Italians | 99.1 /100 | #68 | Exceptional 85.0% |
| Sudanese | 99.0 /100 | #69 | Exceptional 85.0% |
| Brazilians | 99.0 /100 | #70 | Exceptional 85.0% |
| Russians | 99.0 /100 | #71 | Exceptional 85.0% |
| Immigrants | Singapore | 98.9 /100 | #72 | Exceptional 85.0% |
| Immigrants | Sri Lanka | 98.9 /100 | #73 | Exceptional 85.0% |
| Colombians | 98.8 /100 | #74 | Exceptional 85.0% |
| Immigrants | South Central Asia | 98.7 /100 | #75 | Exceptional 85.0% |
| Immigrants | Cuba | 98.6 /100 | #76 | Exceptional 84.9% |
| Immigrants | Turkey | 98.6 /100 | #77 | Exceptional 84.9% |
| Immigrants | Africa | 98.4 /100 | #78 | Exceptional 84.9% |
| Peruvians | 98.3 /100 | #79 | Exceptional 84.9% |