Chippewa vs Immigrants from Eastern Africa In Labor Force | Age > 16
COMPARE
Chippewa
Immigrants from Eastern Africa
In Labor Force | Age > 16
In Labor Force | Age > 16 Comparison
Chippewa
Immigrants from Eastern Africa
63.1%
IN LABOR FORCE | AGE > 16
0.0/ 100
METRIC RATING
313th/ 347
METRIC RANK
68.5%
IN LABOR FORCE | AGE > 16
100.0/ 100
METRIC RATING
9th/ 347
METRIC RANK
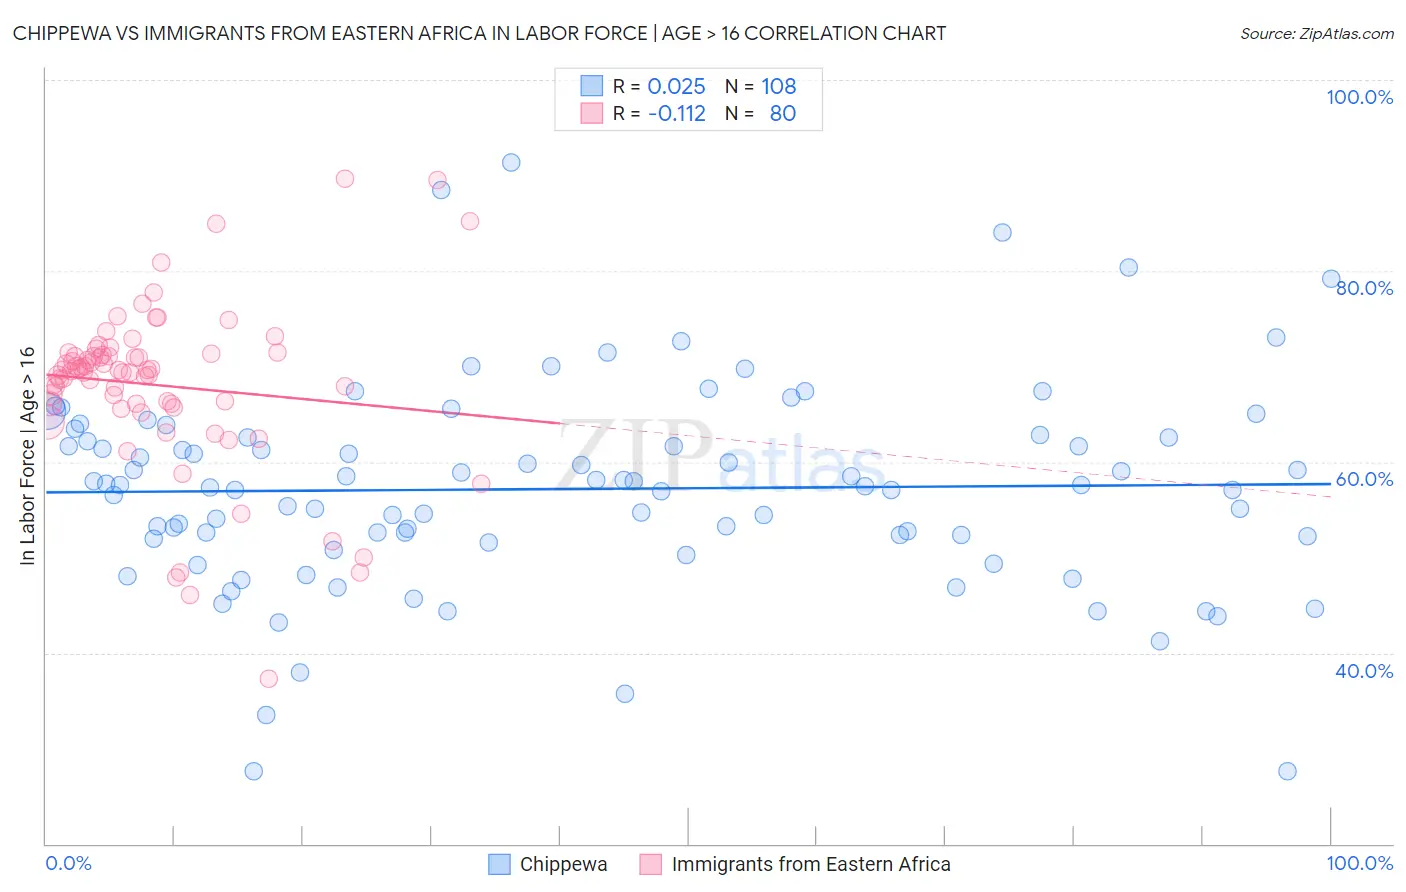
Chippewa vs Immigrants from Eastern Africa In Labor Force | Age > 16 Correlation Chart
The statistical analysis conducted on geographies consisting of 215,053,820 people shows no correlation between the proportion of Chippewa and labor force participation rate among population ages 16 and over in the United States with a correlation coefficient (R) of 0.025 and weighted average of 63.1%. Similarly, the statistical analysis conducted on geographies consisting of 355,171,869 people shows a poor negative correlation between the proportion of Immigrants from Eastern Africa and labor force participation rate among population ages 16 and over in the United States with a correlation coefficient (R) of -0.112 and weighted average of 68.5%, a difference of 8.5%.
In Labor Force | Age > 16 Correlation Summary
| Measurement | Chippewa | Immigrants from Eastern Africa |
| Minimum | 27.6% | 37.3% |
| Maximum | 91.3% | 89.6% |
| Range | 63.7% | 52.3% |
| Mean | 57.2% | 68.0% |
| Median | 57.5% | 69.5% |
| Interquartile 25% (IQ1) | 52.1% | 66.0% |
| Interquartile 75% (IQ3) | 62.5% | 71.3% |
| Interquartile Range (IQR) | 10.4% | 5.2% |
| Standard Deviation (Sample) | 10.7% | 8.8% |
| Standard Deviation (Population) | 10.7% | 8.7% |
Similar Demographics by In Labor Force | Age > 16
Demographics Similar to Chippewa by In Labor Force | Age > 16
In terms of in labor force | age > 16, the demographic groups most similar to Chippewa are Yaqui (63.0%, a difference of 0.10%), Iroquois (63.2%, a difference of 0.13%), Blackfeet (63.2%, a difference of 0.19%), Shoshone (63.2%, a difference of 0.20%), and Scotch-Irish (63.3%, a difference of 0.27%).
| Demographics | Rating | Rank | In Labor Force | Age > 16 |
| Blacks/African Americans | 0.0 /100 | #306 | Tragic 63.4% |
| Central American Indians | 0.0 /100 | #307 | Tragic 63.4% |
| Pennsylvania Germans | 0.0 /100 | #308 | Tragic 63.4% |
| Scotch-Irish | 0.0 /100 | #309 | Tragic 63.3% |
| Shoshone | 0.0 /100 | #310 | Tragic 63.2% |
| Blackfeet | 0.0 /100 | #311 | Tragic 63.2% |
| Iroquois | 0.0 /100 | #312 | Tragic 63.2% |
| Chippewa | 0.0 /100 | #313 | Tragic 63.1% |
| Yaqui | 0.0 /100 | #314 | Tragic 63.0% |
| Potawatomi | 0.0 /100 | #315 | Tragic 62.8% |
| Yup'ik | 0.0 /100 | #316 | Tragic 62.7% |
| Kiowa | 0.0 /100 | #317 | Tragic 62.4% |
| Chickasaw | 0.0 /100 | #318 | Tragic 62.3% |
| Arapaho | 0.0 /100 | #319 | Tragic 62.1% |
| Yakama | 0.0 /100 | #320 | Tragic 62.1% |
Demographics Similar to Immigrants from Eastern Africa by In Labor Force | Age > 16
In terms of in labor force | age > 16, the demographic groups most similar to Immigrants from Eastern Africa are Immigrants from Sierra Leone (68.5%, a difference of 0.010%), Immigrants from Bolivia (68.4%, a difference of 0.030%), Immigrants from Cameroon (68.7%, a difference of 0.33%), Bolivian (68.2%, a difference of 0.40%), and Immigrants from Eritrea (68.9%, a difference of 0.58%).
| Demographics | Rating | Rank | In Labor Force | Age > 16 |
| Ethiopians | 100.0 /100 | #2 | Exceptional 69.3% |
| Somalis | 100.0 /100 | #3 | Exceptional 69.2% |
| Immigrants | Somalia | 100.0 /100 | #4 | Exceptional 69.1% |
| Sierra Leoneans | 100.0 /100 | #5 | Exceptional 68.9% |
| Immigrants | Eritrea | 100.0 /100 | #6 | Exceptional 68.9% |
| Immigrants | Cameroon | 100.0 /100 | #7 | Exceptional 68.7% |
| Immigrants | Sierra Leone | 100.0 /100 | #8 | Exceptional 68.5% |
| Immigrants | Eastern Africa | 100.0 /100 | #9 | Exceptional 68.5% |
| Immigrants | Bolivia | 100.0 /100 | #10 | Exceptional 68.4% |
| Bolivians | 100.0 /100 | #11 | Exceptional 68.2% |
| Sudanese | 100.0 /100 | #12 | Exceptional 68.0% |
| Immigrants | Nepal | 100.0 /100 | #13 | Exceptional 68.0% |
| Liberians | 100.0 /100 | #14 | Exceptional 67.8% |
| Immigrants | Middle Africa | 100.0 /100 | #15 | Exceptional 67.7% |
| Immigrants | Sudan | 100.0 /100 | #16 | Exceptional 67.7% |