Immigrants from Cabo Verde vs Immigrants from Eastern Africa Unemployment Among Women with Children Under 6 years
COMPARE
Immigrants from Cabo Verde
Immigrants from Eastern Africa
Unemployment Among Women with Children Under 6 years
Unemployment Among Women with Children Under 6 years Comparison
Immigrants from Cabo Verde
Immigrants from Eastern Africa
5.4%
UNEMPLOYMENT AMONG WOMEN WITH CHILDREN UNDER 6 YEARS
100.0/ 100
METRIC RATING
1st/ 347
METRIC RANK
7.2%
UNEMPLOYMENT AMONG WOMEN WITH CHILDREN UNDER 6 YEARS
97.7/ 100
METRIC RATING
96th/ 347
METRIC RANK
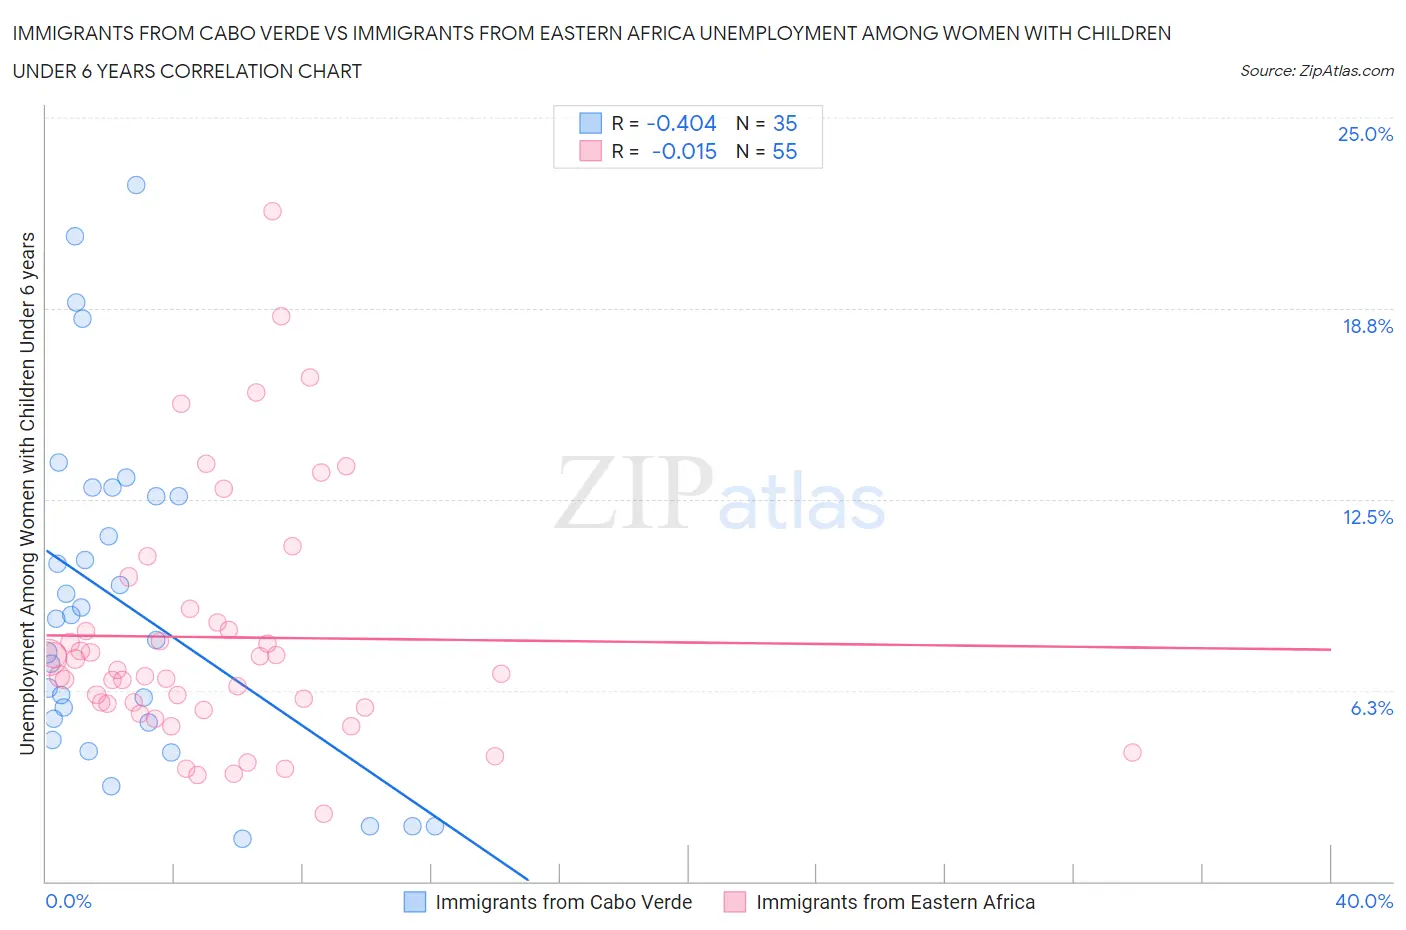
Immigrants from Cabo Verde vs Immigrants from Eastern Africa Unemployment Among Women with Children Under 6 years Correlation Chart
The statistical analysis conducted on geographies consisting of 34,461,767 people shows a moderate negative correlation between the proportion of Immigrants from Cabo Verde and unemployment rate among women with children under the age of 6 in the United States with a correlation coefficient (R) of -0.404 and weighted average of 5.4%. Similarly, the statistical analysis conducted on geographies consisting of 280,421,039 people shows no correlation between the proportion of Immigrants from Eastern Africa and unemployment rate among women with children under the age of 6 in the United States with a correlation coefficient (R) of -0.015 and weighted average of 7.2%, a difference of 33.2%.
Unemployment Among Women with Children Under 6 years Correlation Summary
| Measurement | Immigrants from Cabo Verde | Immigrants from Eastern Africa |
| Minimum | 1.4% | 2.2% |
| Maximum | 22.8% | 22.0% |
| Range | 21.4% | 19.8% |
| Mean | 9.1% | 8.0% |
| Median | 8.6% | 6.8% |
| Interquartile 25% (IQ1) | 5.2% | 5.7% |
| Interquartile 75% (IQ3) | 12.6% | 8.5% |
| Interquartile Range (IQR) | 7.4% | 2.8% |
| Standard Deviation (Sample) | 5.5% | 4.0% |
| Standard Deviation (Population) | 5.4% | 4.0% |
Similar Demographics by Unemployment Among Women with Children Under 6 years
Demographics Similar to Immigrants from Cabo Verde by Unemployment Among Women with Children Under 6 years
In terms of unemployment among women with children under 6 years, the demographic groups most similar to Immigrants from Cabo Verde are Immigrants from Hong Kong (5.8%, a difference of 7.4%), Okinawan (5.8%, a difference of 8.3%), Cambodian (5.9%, a difference of 9.3%), Cape Verdean (5.9%, a difference of 10.4%), and Immigrants from Taiwan (6.0%, a difference of 12.3%).
| Demographics | Rating | Rank | Unemployment Among Women with Children Under 6 years |
| Immigrants | Cabo Verde | 100.0 /100 | #1 | Exceptional 5.4% |
| Immigrants | Hong Kong | 100.0 /100 | #2 | Exceptional 5.8% |
| Okinawans | 100.0 /100 | #3 | Exceptional 5.8% |
| Cambodians | 100.0 /100 | #4 | Exceptional 5.9% |
| Cape Verdeans | 100.0 /100 | #5 | Exceptional 5.9% |
| Immigrants | Taiwan | 100.0 /100 | #6 | Exceptional 6.0% |
| Taiwanese | 100.0 /100 | #7 | Exceptional 6.1% |
| Immigrants | India | 100.0 /100 | #8 | Exceptional 6.1% |
| Filipinos | 100.0 /100 | #9 | Exceptional 6.1% |
| Immigrants | China | 100.0 /100 | #10 | Exceptional 6.2% |
| Indians (Asian) | 100.0 /100 | #11 | Exceptional 6.3% |
| Immigrants | Singapore | 100.0 /100 | #12 | Exceptional 6.3% |
| Immigrants | Eastern Asia | 100.0 /100 | #13 | Exceptional 6.3% |
| Immigrants | Bulgaria | 100.0 /100 | #14 | Exceptional 6.3% |
| Thais | 100.0 /100 | #15 | Exceptional 6.3% |
Demographics Similar to Immigrants from Eastern Africa by Unemployment Among Women with Children Under 6 years
In terms of unemployment among women with children under 6 years, the demographic groups most similar to Immigrants from Eastern Africa are Romanian (7.2%, a difference of 0.010%), Macedonian (7.2%, a difference of 0.060%), Immigrants from South Eastern Asia (7.2%, a difference of 0.080%), Russian (7.2%, a difference of 0.11%), and New Zealander (7.2%, a difference of 0.13%).
| Demographics | Rating | Rank | Unemployment Among Women with Children Under 6 years |
| Immigrants | Denmark | 98.3 /100 | #89 | Exceptional 7.1% |
| Immigrants | Spain | 98.2 /100 | #90 | Exceptional 7.1% |
| Danes | 98.2 /100 | #91 | Exceptional 7.1% |
| Albanians | 98.0 /100 | #92 | Exceptional 7.2% |
| New Zealanders | 97.8 /100 | #93 | Exceptional 7.2% |
| Macedonians | 97.7 /100 | #94 | Exceptional 7.2% |
| Romanians | 97.7 /100 | #95 | Exceptional 7.2% |
| Immigrants | Eastern Africa | 97.7 /100 | #96 | Exceptional 7.2% |
| Immigrants | South Eastern Asia | 97.6 /100 | #97 | Exceptional 7.2% |
| Russians | 97.5 /100 | #98 | Exceptional 7.2% |
| Immigrants | Europe | 97.5 /100 | #99 | Exceptional 7.2% |
| Immigrants | Northern Europe | 97.4 /100 | #100 | Exceptional 7.2% |
| Chileans | 97.4 /100 | #101 | Exceptional 7.2% |
| Immigrants | Nicaragua | 97.3 /100 | #102 | Exceptional 7.2% |
| Immigrants | Saudi Arabia | 97.3 /100 | #103 | Exceptional 7.2% |