Immigrants from Bulgaria vs Sudanese Householder Income Under 25 years
COMPARE
Immigrants from Bulgaria
Sudanese
Householder Income Under 25 years
Householder Income Under 25 years Comparison
Immigrants from Bulgaria
Sudanese
$53,305
HOUSEHOLDER INCOME UNDER 25 YEARS
93.9/ 100
METRIC RATING
128th/ 347
METRIC RANK
$46,982
HOUSEHOLDER INCOME UNDER 25 YEARS
0.0/ 100
METRIC RATING
316th/ 347
METRIC RANK
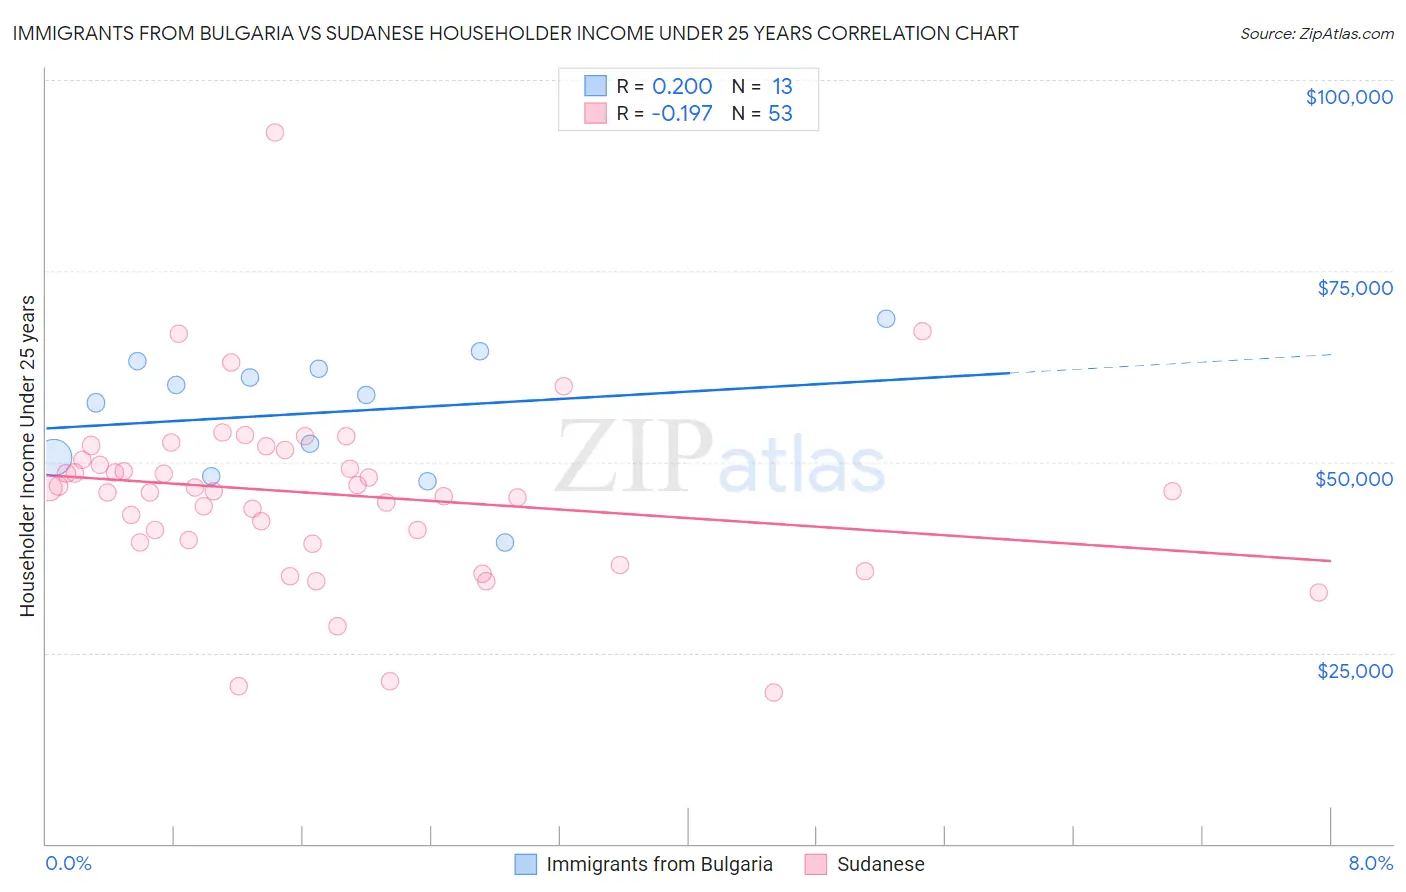
Immigrants from Bulgaria vs Sudanese Householder Income Under 25 years Correlation Chart
The statistical analysis conducted on geographies consisting of 155,914,228 people shows a weak positive correlation between the proportion of Immigrants from Bulgaria and household income with householder under the age of 25 in the United States with a correlation coefficient (R) of 0.200 and weighted average of $53,305. Similarly, the statistical analysis conducted on geographies consisting of 104,582,172 people shows a poor negative correlation between the proportion of Sudanese and household income with householder under the age of 25 in the United States with a correlation coefficient (R) of -0.197 and weighted average of $46,982, a difference of 13.5%.
Householder Income Under 25 years Correlation Summary
| Measurement | Immigrants from Bulgaria | Sudanese |
| Minimum | $39,500 | $19,757 |
| Maximum | $68,750 | $93,063 |
| Range | $29,250 | $73,306 |
| Mean | $56,467 | $45,800 |
| Median | $58,750 | $46,181 |
| Interquartile 25% (IQ1) | $49,292 | $39,636 |
| Interquartile 75% (IQ3) | $62,732 | $50,904 |
| Interquartile Range (IQR) | $13,440 | $11,268 |
| Standard Deviation (Sample) | $8,296 | $11,891 |
| Standard Deviation (Population) | $7,971 | $11,778 |
Similar Demographics by Householder Income Under 25 years
Demographics Similar to Immigrants from Bulgaria by Householder Income Under 25 years
In terms of householder income under 25 years, the demographic groups most similar to Immigrants from Bulgaria are Immigrants from North America ($53,307, a difference of 0.0%), New Zealander ($53,294, a difference of 0.020%), Immigrants from Serbia ($53,321, a difference of 0.030%), Pakistani ($53,325, a difference of 0.040%), and Nicaraguan ($53,275, a difference of 0.060%).
| Demographics | Rating | Rank | Householder Income Under 25 years |
| Immigrants | Canada | 95.2 /100 | #121 | Exceptional $53,411 |
| Immigrants | Ethiopia | 95.2 /100 | #122 | Exceptional $53,408 |
| Immigrants | Iraq | 94.9 /100 | #123 | Exceptional $53,384 |
| Colombians | 94.6 /100 | #124 | Exceptional $53,357 |
| Pakistanis | 94.1 /100 | #125 | Exceptional $53,325 |
| Immigrants | Serbia | 94.1 /100 | #126 | Exceptional $53,321 |
| Immigrants | North America | 93.9 /100 | #127 | Exceptional $53,307 |
| Immigrants | Bulgaria | 93.9 /100 | #128 | Exceptional $53,305 |
| New Zealanders | 93.7 /100 | #129 | Exceptional $53,294 |
| Nicaraguans | 93.4 /100 | #130 | Exceptional $53,275 |
| Immigrants | Nicaragua | 93.3 /100 | #131 | Exceptional $53,266 |
| Moroccans | 93.1 /100 | #132 | Exceptional $53,256 |
| Immigrants | Immigrants | 92.2 /100 | #133 | Exceptional $53,201 |
| Immigrants | Northern Africa | 91.9 /100 | #134 | Exceptional $53,185 |
| Chileans | 91.9 /100 | #135 | Exceptional $53,185 |
Demographics Similar to Sudanese by Householder Income Under 25 years
In terms of householder income under 25 years, the demographic groups most similar to Sudanese are Hopi ($46,978, a difference of 0.010%), Crow ($47,012, a difference of 0.060%), Chippewa ($47,015, a difference of 0.070%), Spanish American ($46,913, a difference of 0.15%), and African ($46,838, a difference of 0.31%).
| Demographics | Rating | Rank | Householder Income Under 25 years |
| U.S. Virgin Islanders | 0.0 /100 | #309 | Tragic $47,448 |
| Iroquois | 0.0 /100 | #310 | Tragic $47,380 |
| Ottawa | 0.0 /100 | #311 | Tragic $47,366 |
| Bermudans | 0.0 /100 | #312 | Tragic $47,359 |
| Delaware | 0.0 /100 | #313 | Tragic $47,159 |
| Chippewa | 0.0 /100 | #314 | Tragic $47,015 |
| Crow | 0.0 /100 | #315 | Tragic $47,012 |
| Sudanese | 0.0 /100 | #316 | Tragic $46,982 |
| Hopi | 0.0 /100 | #317 | Tragic $46,978 |
| Spanish Americans | 0.0 /100 | #318 | Tragic $46,913 |
| Africans | 0.0 /100 | #319 | Tragic $46,838 |
| Immigrants | Sudan | 0.0 /100 | #320 | Tragic $46,791 |
| Potawatomi | 0.0 /100 | #321 | Tragic $46,462 |
| Sioux | 0.0 /100 | #322 | Tragic $46,417 |
| Immigrants | Saudi Arabia | 0.0 /100 | #323 | Tragic $46,187 |