Immigrants from Singapore vs Mexican American Indian In Labor Force | Age 35-44
COMPARE
Immigrants from Singapore
Mexican American Indian
In Labor Force | Age 35-44
In Labor Force | Age 35-44 Comparison
Immigrants from Singapore
Mexican American Indians
85.0%
IN LABOR FORCE | AGE 35-44
98.9/ 100
METRIC RATING
72nd/ 347
METRIC RANK
82.6%
IN LABOR FORCE | AGE 35-44
0.0/ 100
METRIC RATING
296th/ 347
METRIC RANK
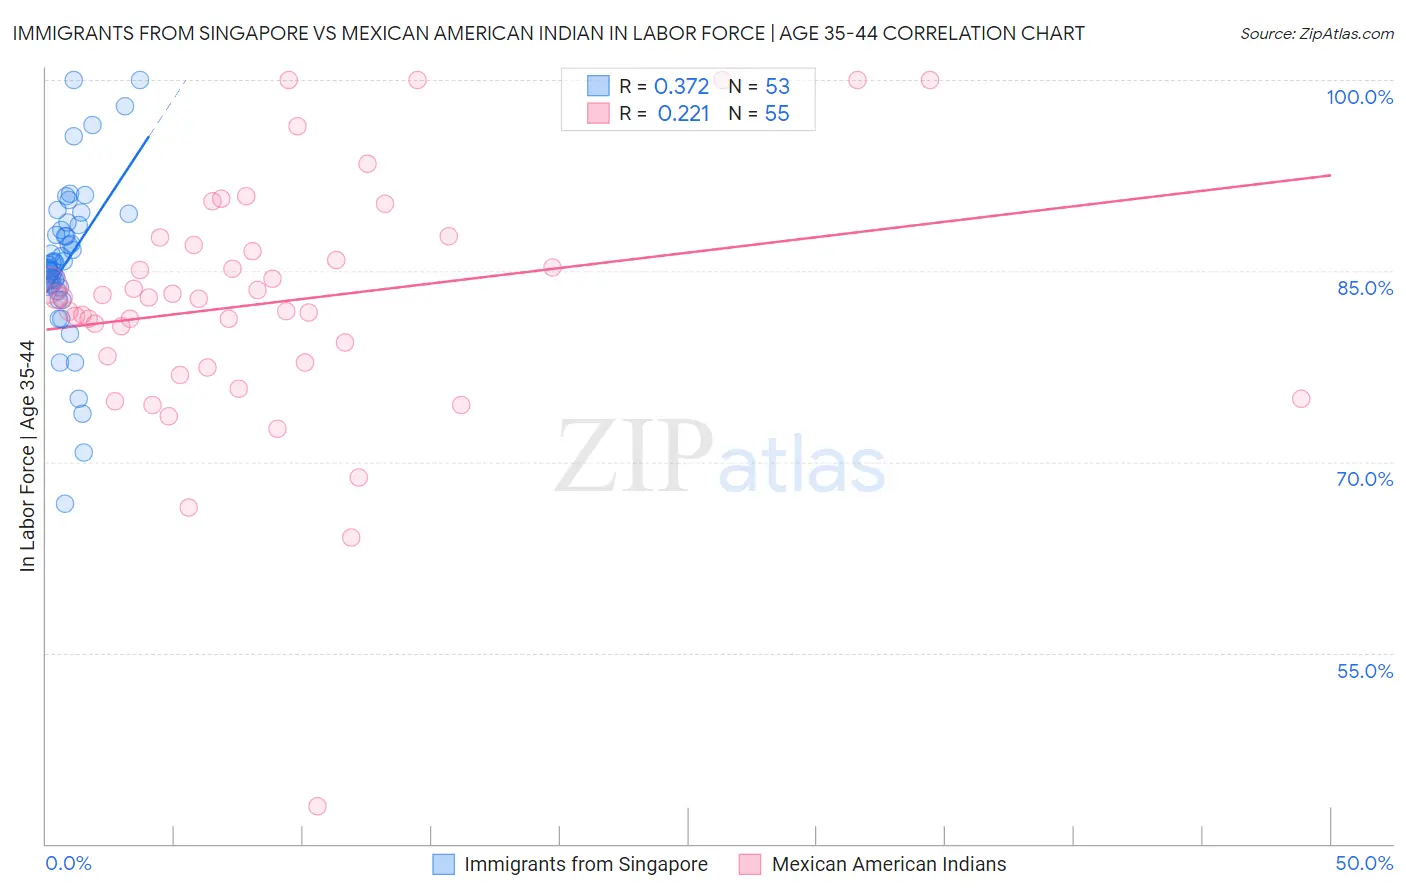
Immigrants from Singapore vs Mexican American Indian In Labor Force | Age 35-44 Correlation Chart
The statistical analysis conducted on geographies consisting of 137,454,935 people shows a mild positive correlation between the proportion of Immigrants from Singapore and labor force participation rate among population between the ages 35 and 44 in the United States with a correlation coefficient (R) of 0.372 and weighted average of 85.0%. Similarly, the statistical analysis conducted on geographies consisting of 317,545,912 people shows a weak positive correlation between the proportion of Mexican American Indians and labor force participation rate among population between the ages 35 and 44 in the United States with a correlation coefficient (R) of 0.221 and weighted average of 82.6%, a difference of 2.9%.
In Labor Force | Age 35-44 Correlation Summary
| Measurement | Immigrants from Singapore | Mexican American Indian |
| Minimum | 66.7% | 42.9% |
| Maximum | 100.0% | 100.0% |
| Range | 33.3% | 57.1% |
| Mean | 85.7% | 82.6% |
| Median | 85.7% | 82.9% |
| Interquartile 25% (IQ1) | 83.8% | 77.8% |
| Interquartile 75% (IQ3) | 88.7% | 87.0% |
| Interquartile Range (IQR) | 4.9% | 9.2% |
| Standard Deviation (Sample) | 6.3% | 9.8% |
| Standard Deviation (Population) | 6.2% | 9.7% |
Similar Demographics by In Labor Force | Age 35-44
Demographics Similar to Immigrants from Singapore by In Labor Force | Age 35-44
In terms of in labor force | age 35-44, the demographic groups most similar to Immigrants from Singapore are Immigrants from Sri Lanka (85.0%, a difference of 0.0%), Colombian (85.0%, a difference of 0.010%), Brazilian (85.0%, a difference of 0.020%), Russian (85.0%, a difference of 0.020%), and Immigrants from South Central Asia (85.0%, a difference of 0.020%).
| Demographics | Rating | Rank | In Labor Force | Age 35-44 |
| Immigrants | Brazil | 99.2 /100 | #65 | Exceptional 85.0% |
| Immigrants | Haiti | 99.1 /100 | #66 | Exceptional 85.0% |
| Immigrants | Italy | 99.1 /100 | #67 | Exceptional 85.0% |
| Italians | 99.1 /100 | #68 | Exceptional 85.0% |
| Sudanese | 99.0 /100 | #69 | Exceptional 85.0% |
| Brazilians | 99.0 /100 | #70 | Exceptional 85.0% |
| Russians | 99.0 /100 | #71 | Exceptional 85.0% |
| Immigrants | Singapore | 98.9 /100 | #72 | Exceptional 85.0% |
| Immigrants | Sri Lanka | 98.9 /100 | #73 | Exceptional 85.0% |
| Colombians | 98.8 /100 | #74 | Exceptional 85.0% |
| Immigrants | South Central Asia | 98.7 /100 | #75 | Exceptional 85.0% |
| Immigrants | Cuba | 98.6 /100 | #76 | Exceptional 84.9% |
| Immigrants | Turkey | 98.6 /100 | #77 | Exceptional 84.9% |
| Immigrants | Africa | 98.4 /100 | #78 | Exceptional 84.9% |
| Peruvians | 98.3 /100 | #79 | Exceptional 84.9% |
Demographics Similar to Mexican American Indians by In Labor Force | Age 35-44
In terms of in labor force | age 35-44, the demographic groups most similar to Mexican American Indians are Hmong (82.6%, a difference of 0.010%), Ottawa (82.6%, a difference of 0.020%), Tlingit-Haida (82.5%, a difference of 0.040%), Immigrants from Lebanon (82.7%, a difference of 0.10%), and Central American Indian (82.5%, a difference of 0.10%).
| Demographics | Rating | Rank | In Labor Force | Age 35-44 |
| Chippewa | 0.0 /100 | #289 | Tragic 82.9% |
| Africans | 0.0 /100 | #290 | Tragic 82.9% |
| Pennsylvania Germans | 0.0 /100 | #291 | Tragic 82.9% |
| Immigrants | Latin America | 0.0 /100 | #292 | Tragic 82.8% |
| Spanish Americans | 0.0 /100 | #293 | Tragic 82.8% |
| Potawatomi | 0.0 /100 | #294 | Tragic 82.7% |
| Immigrants | Lebanon | 0.0 /100 | #295 | Tragic 82.7% |
| Mexican American Indians | 0.0 /100 | #296 | Tragic 82.6% |
| Hmong | 0.0 /100 | #297 | Tragic 82.6% |
| Ottawa | 0.0 /100 | #298 | Tragic 82.6% |
| Tlingit-Haida | 0.0 /100 | #299 | Tragic 82.5% |
| Central American Indians | 0.0 /100 | #300 | Tragic 82.5% |
| Spanish American Indians | 0.0 /100 | #301 | Tragic 82.5% |
| Americans | 0.0 /100 | #302 | Tragic 82.4% |
| Nepalese | 0.0 /100 | #303 | Tragic 82.4% |