Immigrants from Bolivia vs Chinese In Labor Force | Age 16-19
COMPARE
Immigrants from Bolivia
Chinese
In Labor Force | Age 16-19
In Labor Force | Age 16-19 Comparison
Immigrants from Bolivia
Chinese
35.6%
IN LABOR FORCE | AGE 16-19
11.0/ 100
METRIC RATING
213th/ 347
METRIC RANK
38.6%
IN LABOR FORCE | AGE 16-19
98.8/ 100
METRIC RATING
107th/ 347
METRIC RANK
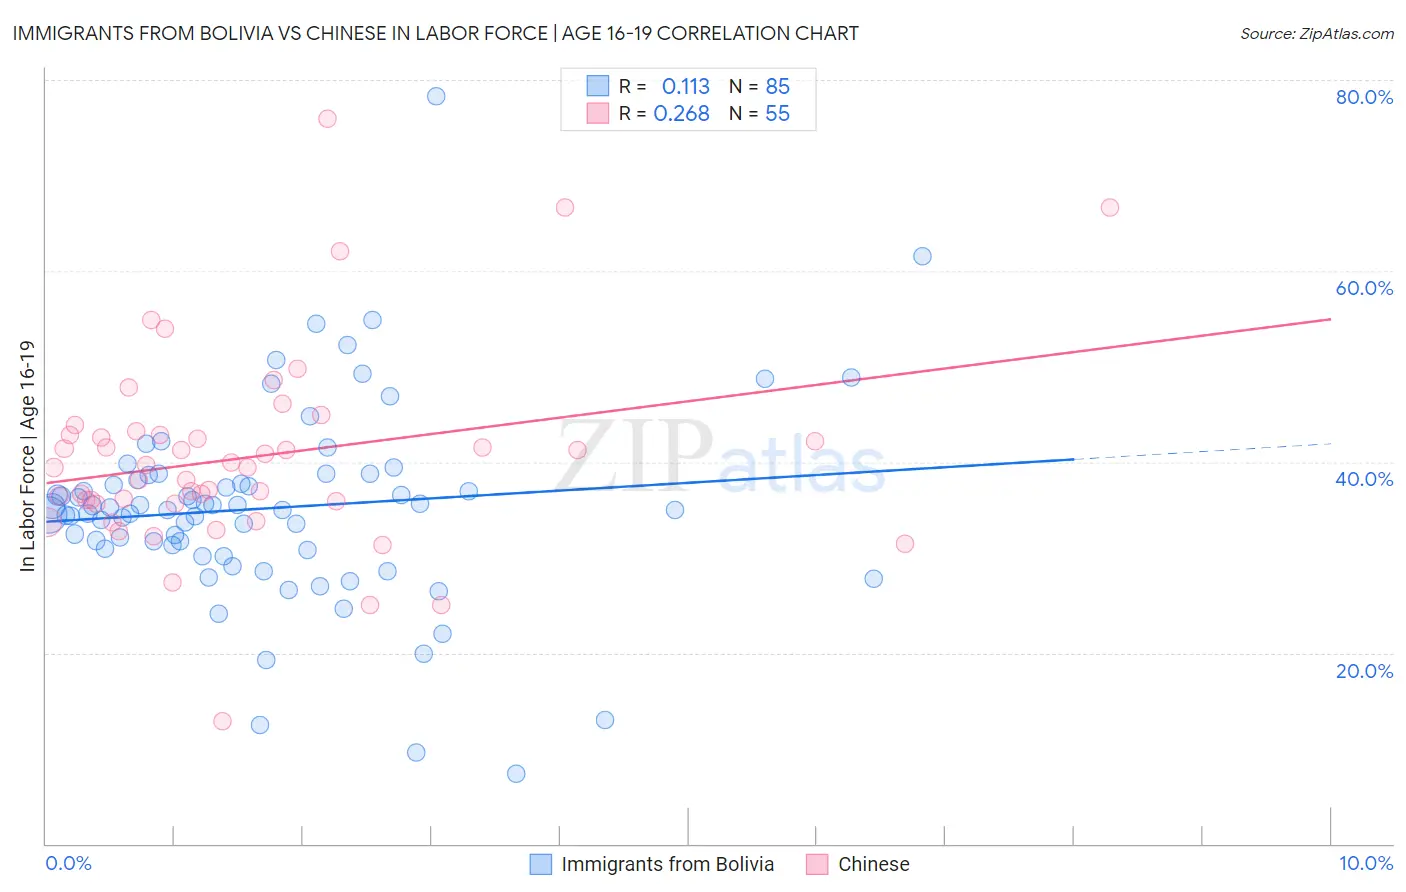
Immigrants from Bolivia vs Chinese In Labor Force | Age 16-19 Correlation Chart
The statistical analysis conducted on geographies consisting of 158,606,636 people shows a poor positive correlation between the proportion of Immigrants from Bolivia and labor force participation rate among population between the ages 16 and 19 in the United States with a correlation coefficient (R) of 0.113 and weighted average of 35.6%. Similarly, the statistical analysis conducted on geographies consisting of 64,804,450 people shows a weak positive correlation between the proportion of Chinese and labor force participation rate among population between the ages 16 and 19 in the United States with a correlation coefficient (R) of 0.268 and weighted average of 38.6%, a difference of 8.4%.
In Labor Force | Age 16-19 Correlation Summary
| Measurement | Immigrants from Bolivia | Chinese |
| Minimum | 7.3% | 12.8% |
| Maximum | 78.3% | 75.9% |
| Range | 71.0% | 63.1% |
| Mean | 35.2% | 40.5% |
| Median | 34.9% | 39.4% |
| Interquartile 25% (IQ1) | 30.9% | 35.7% |
| Interquartile 75% (IQ3) | 38.4% | 42.8% |
| Interquartile Range (IQR) | 7.5% | 7.1% |
| Standard Deviation (Sample) | 10.4% | 10.5% |
| Standard Deviation (Population) | 10.3% | 10.4% |
Similar Demographics by In Labor Force | Age 16-19
Demographics Similar to Immigrants from Bolivia by In Labor Force | Age 16-19
In terms of in labor force | age 16-19, the demographic groups most similar to Immigrants from Bolivia are Houma (35.6%, a difference of 0.0%), Apache (35.6%, a difference of 0.010%), Immigrants from South Eastern Asia (35.6%, a difference of 0.030%), Dutch West Indian (35.6%, a difference of 0.050%), and Immigrants from Costa Rica (35.6%, a difference of 0.050%).
| Demographics | Rating | Rank | In Labor Force | Age 16-19 |
| Chileans | 14.6 /100 | #206 | Poor 35.8% |
| Immigrants | Eastern Europe | 14.5 /100 | #207 | Poor 35.8% |
| Koreans | 13.3 /100 | #208 | Poor 35.7% |
| Moroccans | 12.7 /100 | #209 | Poor 35.7% |
| Immigrants | Switzerland | 11.9 /100 | #210 | Poor 35.6% |
| Mexicans | 11.9 /100 | #211 | Poor 35.6% |
| Houma | 11.0 /100 | #212 | Poor 35.6% |
| Immigrants | Bolivia | 11.0 /100 | #213 | Poor 35.6% |
| Apache | 11.0 /100 | #214 | Poor 35.6% |
| Immigrants | South Eastern Asia | 10.8 /100 | #215 | Poor 35.6% |
| Dutch West Indians | 10.7 /100 | #216 | Poor 35.6% |
| Immigrants | Costa Rica | 10.7 /100 | #217 | Poor 35.6% |
| Sri Lankans | 9.8 /100 | #218 | Tragic 35.5% |
| Guatemalans | 8.6 /100 | #219 | Tragic 35.5% |
| Immigrants | Bahamas | 8.3 /100 | #220 | Tragic 35.5% |
Demographics Similar to Chinese by In Labor Force | Age 16-19
In terms of in labor force | age 16-19, the demographic groups most similar to Chinese are Delaware (38.6%, a difference of 0.030%), Iraqi (38.6%, a difference of 0.050%), Immigrants from Ethiopia (38.6%, a difference of 0.10%), Lebanese (38.6%, a difference of 0.10%), and Immigrants from Eritrea (38.7%, a difference of 0.21%).
| Demographics | Rating | Rank | In Labor Force | Age 16-19 |
| Immigrants | Thailand | 99.1 /100 | #100 | Exceptional 38.7% |
| Hmong | 99.1 /100 | #101 | Exceptional 38.7% |
| Zimbabweans | 99.1 /100 | #102 | Exceptional 38.7% |
| Immigrants | Cameroon | 99.0 /100 | #103 | Exceptional 38.7% |
| Immigrants | Eritrea | 99.0 /100 | #104 | Exceptional 38.7% |
| Iraqis | 98.9 /100 | #105 | Exceptional 38.6% |
| Delaware | 98.8 /100 | #106 | Exceptional 38.6% |
| Chinese | 98.8 /100 | #107 | Exceptional 38.6% |
| Immigrants | Ethiopia | 98.7 /100 | #108 | Exceptional 38.6% |
| Lebanese | 98.7 /100 | #109 | Exceptional 38.6% |
| Maltese | 98.6 /100 | #110 | Exceptional 38.5% |
| Crow | 98.5 /100 | #111 | Exceptional 38.5% |
| Immigrants | Scotland | 98.5 /100 | #112 | Exceptional 38.5% |
| Sub-Saharan Africans | 98.3 /100 | #113 | Exceptional 38.4% |
| Hawaiians | 98.2 /100 | #114 | Exceptional 38.4% |