Peruvian vs Chinese In Labor Force | Age 16-19
COMPARE
Peruvian
Chinese
In Labor Force | Age 16-19
In Labor Force | Age 16-19 Comparison
Peruvians
Chinese
34.6%
IN LABOR FORCE | AGE 16-19
1.4/ 100
METRIC RATING
255th/ 347
METRIC RANK
38.6%
IN LABOR FORCE | AGE 16-19
98.8/ 100
METRIC RATING
107th/ 347
METRIC RANK
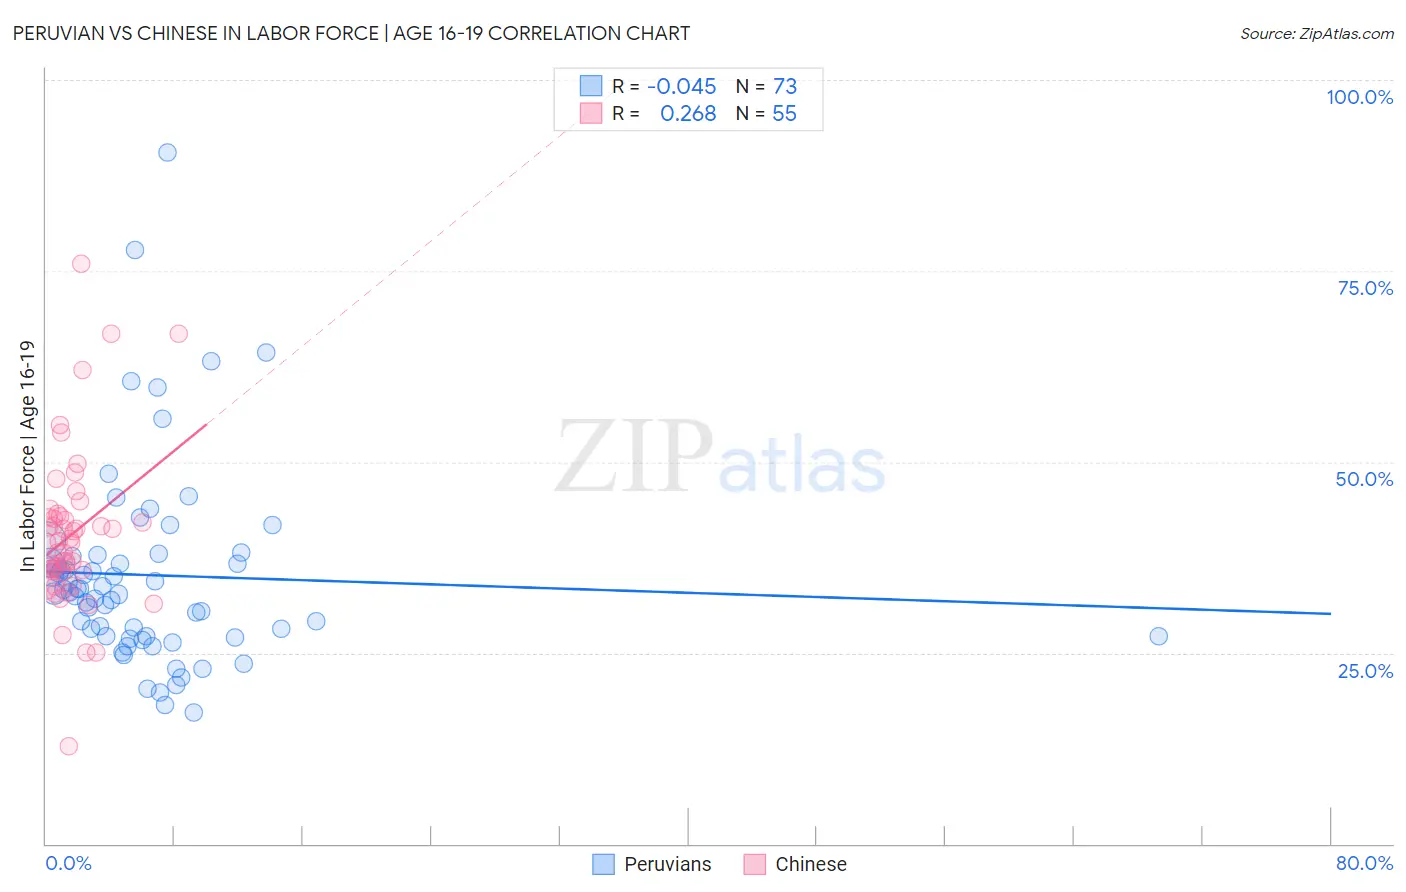
Peruvian vs Chinese In Labor Force | Age 16-19 Correlation Chart
The statistical analysis conducted on geographies consisting of 362,835,907 people shows no correlation between the proportion of Peruvians and labor force participation rate among population between the ages 16 and 19 in the United States with a correlation coefficient (R) of -0.045 and weighted average of 34.6%. Similarly, the statistical analysis conducted on geographies consisting of 64,804,450 people shows a weak positive correlation between the proportion of Chinese and labor force participation rate among population between the ages 16 and 19 in the United States with a correlation coefficient (R) of 0.268 and weighted average of 38.6%, a difference of 11.6%.
In Labor Force | Age 16-19 Correlation Summary
| Measurement | Peruvian | Chinese |
| Minimum | 17.1% | 12.8% |
| Maximum | 90.5% | 75.9% |
| Range | 73.4% | 63.1% |
| Mean | 35.2% | 40.5% |
| Median | 33.0% | 39.4% |
| Interquartile 25% (IQ1) | 27.1% | 35.7% |
| Interquartile 75% (IQ3) | 37.8% | 42.8% |
| Interquartile Range (IQR) | 10.6% | 7.1% |
| Standard Deviation (Sample) | 12.9% | 10.5% |
| Standard Deviation (Population) | 12.8% | 10.4% |
Similar Demographics by In Labor Force | Age 16-19
Demographics Similar to Peruvians by In Labor Force | Age 16-19
In terms of in labor force | age 16-19, the demographic groups most similar to Peruvians are Bahamian (34.6%, a difference of 0.040%), Immigrants from South Central Asia (34.6%, a difference of 0.11%), Immigrants from Egypt (34.6%, a difference of 0.11%), Thai (34.6%, a difference of 0.12%), and Immigrants (34.6%, a difference of 0.13%).
| Demographics | Rating | Rank | In Labor Force | Age 16-19 |
| Central Americans | 2.2 /100 | #248 | Tragic 34.8% |
| Immigrants | Ukraine | 2.2 /100 | #249 | Tragic 34.8% |
| Immigrants | Pakistan | 2.0 /100 | #250 | Tragic 34.8% |
| Immigrants | Western Asia | 2.0 /100 | #251 | Tragic 34.8% |
| Immigrants | Chile | 2.0 /100 | #252 | Tragic 34.8% |
| Immigrants | Japan | 1.5 /100 | #253 | Tragic 34.7% |
| Bahamians | 1.4 /100 | #254 | Tragic 34.6% |
| Peruvians | 1.4 /100 | #255 | Tragic 34.6% |
| Immigrants | South Central Asia | 1.3 /100 | #256 | Tragic 34.6% |
| Immigrants | Egypt | 1.2 /100 | #257 | Tragic 34.6% |
| Thais | 1.2 /100 | #258 | Tragic 34.6% |
| Immigrants | Immigrants | 1.2 /100 | #259 | Tragic 34.6% |
| Egyptians | 1.2 /100 | #260 | Tragic 34.5% |
| Salvadorans | 1.1 /100 | #261 | Tragic 34.5% |
| Hispanics or Latinos | 1.1 /100 | #262 | Tragic 34.5% |
Demographics Similar to Chinese by In Labor Force | Age 16-19
In terms of in labor force | age 16-19, the demographic groups most similar to Chinese are Delaware (38.6%, a difference of 0.030%), Iraqi (38.6%, a difference of 0.050%), Immigrants from Ethiopia (38.6%, a difference of 0.10%), Lebanese (38.6%, a difference of 0.10%), and Immigrants from Eritrea (38.7%, a difference of 0.21%).
| Demographics | Rating | Rank | In Labor Force | Age 16-19 |
| Immigrants | Thailand | 99.1 /100 | #100 | Exceptional 38.7% |
| Hmong | 99.1 /100 | #101 | Exceptional 38.7% |
| Zimbabweans | 99.1 /100 | #102 | Exceptional 38.7% |
| Immigrants | Cameroon | 99.0 /100 | #103 | Exceptional 38.7% |
| Immigrants | Eritrea | 99.0 /100 | #104 | Exceptional 38.7% |
| Iraqis | 98.9 /100 | #105 | Exceptional 38.6% |
| Delaware | 98.8 /100 | #106 | Exceptional 38.6% |
| Chinese | 98.8 /100 | #107 | Exceptional 38.6% |
| Immigrants | Ethiopia | 98.7 /100 | #108 | Exceptional 38.6% |
| Lebanese | 98.7 /100 | #109 | Exceptional 38.6% |
| Maltese | 98.6 /100 | #110 | Exceptional 38.5% |
| Crow | 98.5 /100 | #111 | Exceptional 38.5% |
| Immigrants | Scotland | 98.5 /100 | #112 | Exceptional 38.5% |
| Sub-Saharan Africans | 98.3 /100 | #113 | Exceptional 38.4% |
| Hawaiians | 98.2 /100 | #114 | Exceptional 38.4% |