Immigrants from South Africa vs Immigrants from Hungary In Labor Force | Age 20-64
COMPARE
Immigrants from South Africa
Immigrants from Hungary
In Labor Force | Age 20-64
In Labor Force | Age 20-64 Comparison
Immigrants from South Africa
Immigrants from Hungary
79.7%
IN LABOR FORCE | AGE 20-64
69.2/ 100
METRIC RATING
155th/ 347
METRIC RANK
79.5%
IN LABOR FORCE | AGE 20-64
36.8/ 100
METRIC RATING
183rd/ 347
METRIC RANK
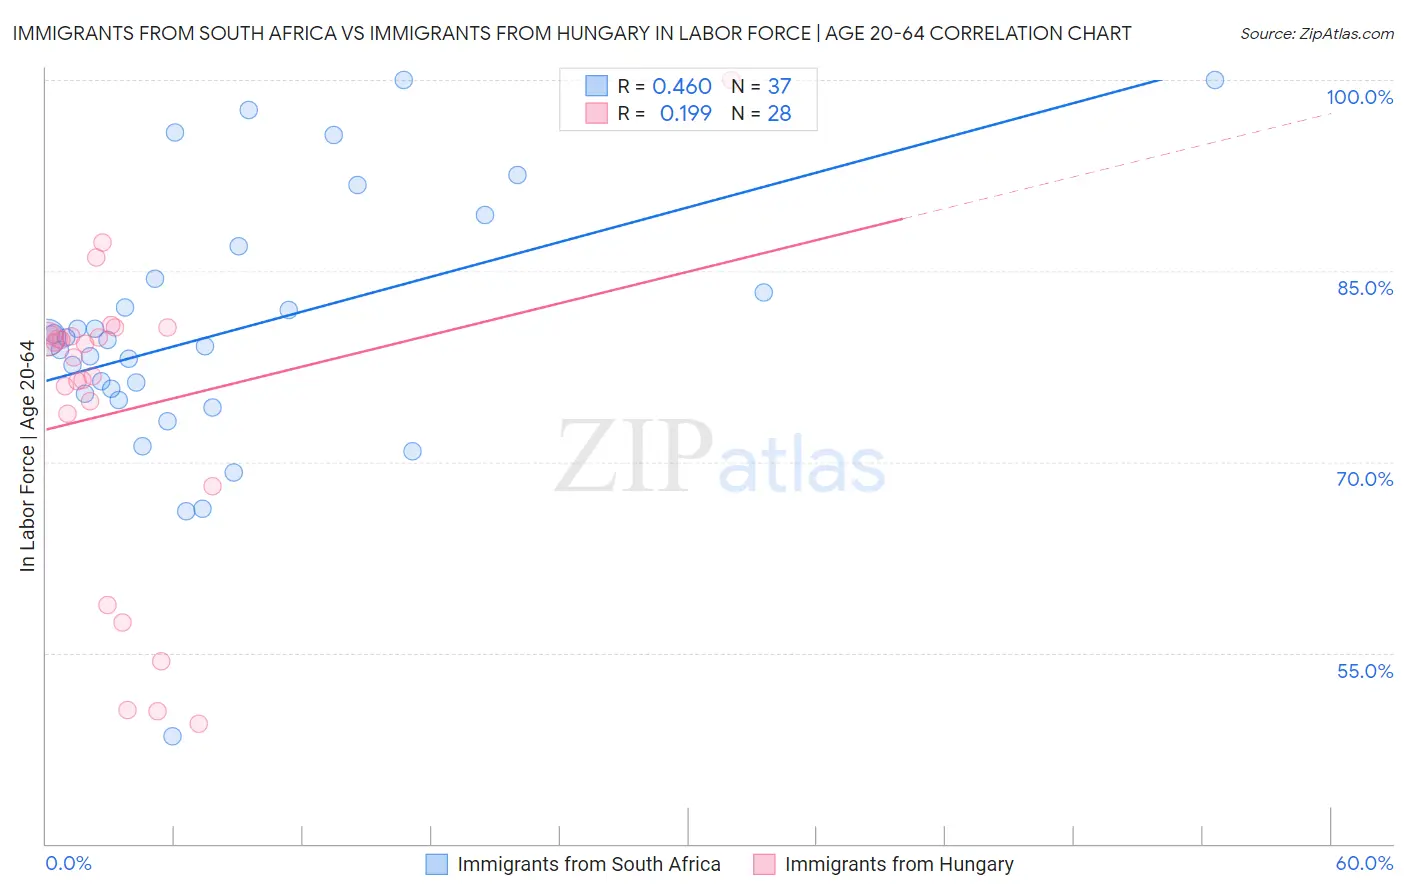
Immigrants from South Africa vs Immigrants from Hungary In Labor Force | Age 20-64 Correlation Chart
The statistical analysis conducted on geographies consisting of 233,321,887 people shows a moderate positive correlation between the proportion of Immigrants from South Africa and labor force participation rate among population between the ages 20 and 64 in the United States with a correlation coefficient (R) of 0.460 and weighted average of 79.7%. Similarly, the statistical analysis conducted on geographies consisting of 195,708,395 people shows a poor positive correlation between the proportion of Immigrants from Hungary and labor force participation rate among population between the ages 20 and 64 in the United States with a correlation coefficient (R) of 0.199 and weighted average of 79.5%, a difference of 0.27%.
In Labor Force | Age 20-64 Correlation Summary
| Measurement | Immigrants from South Africa | Immigrants from Hungary |
| Minimum | 48.4% | 49.4% |
| Maximum | 100.0% | 100.0% |
| Range | 51.6% | 50.6% |
| Mean | 80.3% | 74.1% |
| Median | 79.6% | 78.7% |
| Interquartile 25% (IQ1) | 75.1% | 70.9% |
| Interquartile 75% (IQ3) | 85.6% | 79.9% |
| Interquartile Range (IQR) | 10.5% | 9.0% |
| Standard Deviation (Sample) | 10.4% | 12.3% |
| Standard Deviation (Population) | 10.3% | 12.1% |
Similar Demographics by In Labor Force | Age 20-64
Demographics Similar to Immigrants from South Africa by In Labor Force | Age 20-64
In terms of in labor force | age 20-64, the demographic groups most similar to Immigrants from South Africa are Immigrants from Kazakhstan (79.7%, a difference of 0.0%), New Zealander (79.7%, a difference of 0.0%), Senegalese (79.7%, a difference of 0.0%), Immigrants from China (79.7%, a difference of 0.0%), and Austrian (79.7%, a difference of 0.010%).
| Demographics | Rating | Rank | In Labor Force | Age 20-64 |
| Romanians | 77.6 /100 | #148 | Good 79.8% |
| Icelanders | 75.1 /100 | #149 | Good 79.7% |
| Costa Ricans | 72.4 /100 | #150 | Good 79.7% |
| Scandinavians | 72.0 /100 | #151 | Good 79.7% |
| Immigrants | Northern Europe | 72.0 /100 | #152 | Good 79.7% |
| Immigrants | Kazakhstan | 69.5 /100 | #153 | Good 79.7% |
| New Zealanders | 69.4 /100 | #154 | Good 79.7% |
| Immigrants | South Africa | 69.2 /100 | #155 | Good 79.7% |
| Senegalese | 69.1 /100 | #156 | Good 79.7% |
| Immigrants | China | 69.1 /100 | #157 | Good 79.7% |
| Austrians | 67.6 /100 | #158 | Good 79.7% |
| Immigrants | Cuba | 66.7 /100 | #159 | Good 79.7% |
| Moroccans | 66.7 /100 | #160 | Good 79.7% |
| South Africans | 66.2 /100 | #161 | Good 79.7% |
| Germans | 65.2 /100 | #162 | Good 79.7% |
Demographics Similar to Immigrants from Hungary by In Labor Force | Age 20-64
In terms of in labor force | age 20-64, the demographic groups most similar to Immigrants from Hungary are Malaysian (79.5%, a difference of 0.0%), Immigrants from Saudi Arabia (79.5%, a difference of 0.010%), Finnish (79.5%, a difference of 0.010%), Israeli (79.5%, a difference of 0.020%), and Northern European (79.5%, a difference of 0.020%).
| Demographics | Rating | Rank | In Labor Force | Age 20-64 |
| Australians | 46.0 /100 | #176 | Average 79.5% |
| Immigrants | Netherlands | 45.2 /100 | #177 | Average 79.5% |
| Czechoslovakians | 44.3 /100 | #178 | Average 79.5% |
| Armenians | 41.4 /100 | #179 | Average 79.5% |
| Salvadorans | 41.0 /100 | #180 | Average 79.5% |
| Immigrants | Saudi Arabia | 37.7 /100 | #181 | Fair 79.5% |
| Malaysians | 37.1 /100 | #182 | Fair 79.5% |
| Immigrants | Hungary | 36.8 /100 | #183 | Fair 79.5% |
| Finns | 35.9 /100 | #184 | Fair 79.5% |
| Israelis | 34.7 /100 | #185 | Fair 79.5% |
| Northern Europeans | 34.5 /100 | #186 | Fair 79.5% |
| Assyrians/Chaldeans/Syriacs | 33.3 /100 | #187 | Fair 79.4% |
| Immigrants | Haiti | 32.1 /100 | #188 | Fair 79.4% |
| Immigrants | El Salvador | 30.9 /100 | #189 | Fair 79.4% |
| Immigrants | Syria | 30.8 /100 | #190 | Fair 79.4% |