Immigrants from Belize vs Italian In Labor Force | Age 25-29
COMPARE
Immigrants from Belize
Italian
In Labor Force | Age 25-29
In Labor Force | Age 25-29 Comparison
Immigrants from Belize
Italians
82.8%
IN LABOR FORCE | AGE 25-29
0.0/ 100
METRIC RATING
302nd/ 347
METRIC RANK
85.6%
IN LABOR FORCE | AGE 25-29
99.8/ 100
METRIC RATING
48th/ 347
METRIC RANK
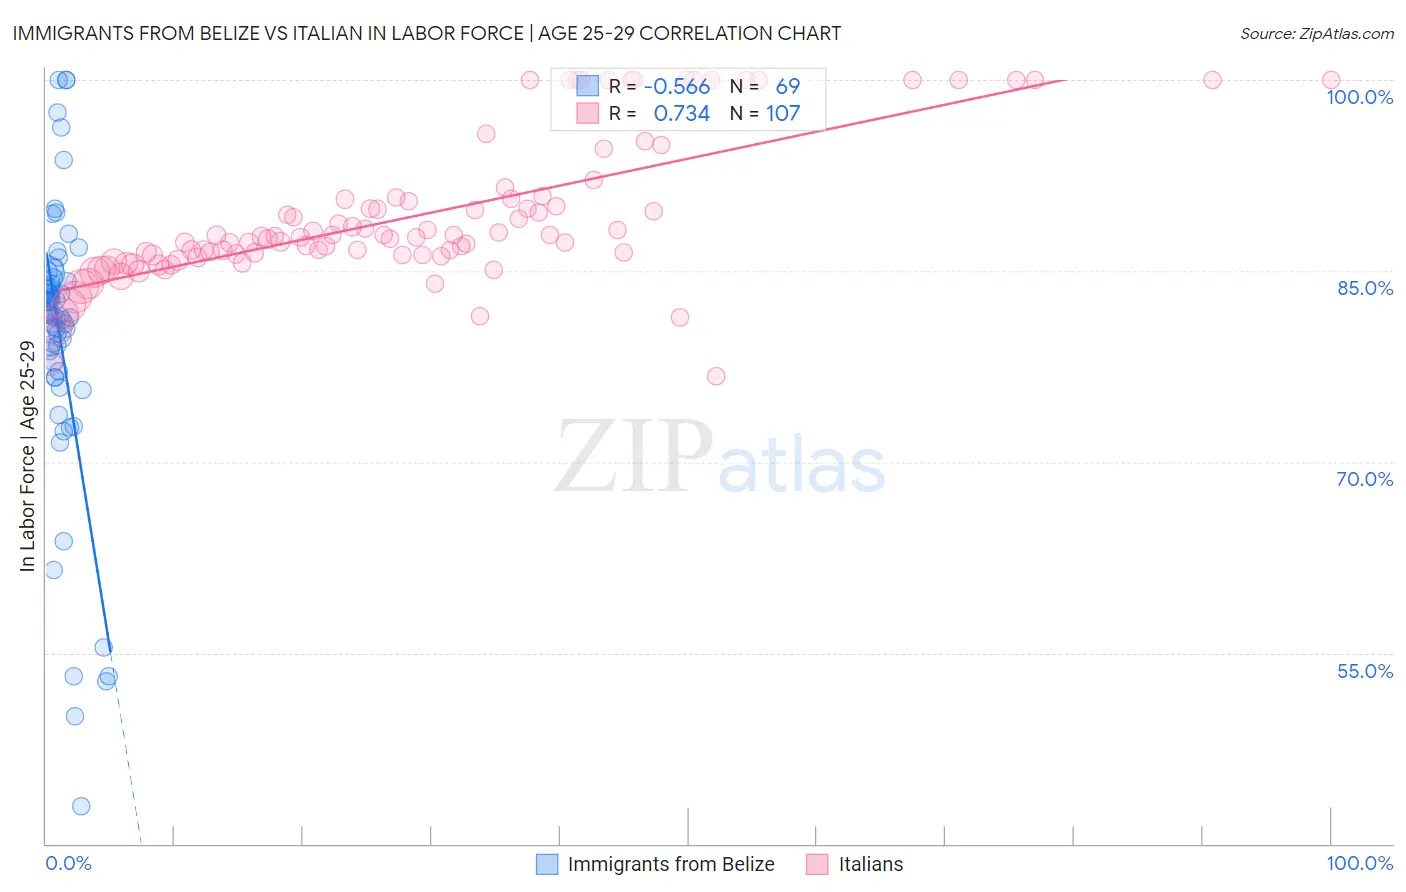
Immigrants from Belize vs Italian In Labor Force | Age 25-29 Correlation Chart
The statistical analysis conducted on geographies consisting of 130,310,210 people shows a substantial negative correlation between the proportion of Immigrants from Belize and labor force participation rate among population between the ages 25 and 29 in the United States with a correlation coefficient (R) of -0.566 and weighted average of 82.8%. Similarly, the statistical analysis conducted on geographies consisting of 573,626,337 people shows a strong positive correlation between the proportion of Italians and labor force participation rate among population between the ages 25 and 29 in the United States with a correlation coefficient (R) of 0.734 and weighted average of 85.6%, a difference of 3.4%.
In Labor Force | Age 25-29 Correlation Summary
| Measurement | Immigrants from Belize | Italian |
| Minimum | 42.9% | 76.8% |
| Maximum | 100.0% | 100.0% |
| Range | 57.1% | 23.2% |
| Mean | 79.6% | 89.3% |
| Median | 81.5% | 87.7% |
| Interquartile 25% (IQ1) | 76.9% | 86.2% |
| Interquartile 75% (IQ3) | 84.3% | 90.7% |
| Interquartile Range (IQR) | 7.5% | 4.5% |
| Standard Deviation (Sample) | 11.3% | 5.7% |
| Standard Deviation (Population) | 11.2% | 5.6% |
Similar Demographics by In Labor Force | Age 25-29
Demographics Similar to Immigrants from Belize by In Labor Force | Age 25-29
In terms of in labor force | age 25-29, the demographic groups most similar to Immigrants from Belize are Immigrants from Grenada (82.8%, a difference of 0.010%), Vietnamese (82.8%, a difference of 0.030%), Spanish American Indian (82.9%, a difference of 0.10%), Fijian (82.9%, a difference of 0.11%), and Native Hawaiian (82.9%, a difference of 0.12%).
| Demographics | Rating | Rank | In Labor Force | Age 25-29 |
| Chippewa | 0.0 /100 | #295 | Tragic 82.9% |
| Immigrants | Nicaragua | 0.0 /100 | #296 | Tragic 82.9% |
| Potawatomi | 0.0 /100 | #297 | Tragic 82.9% |
| Native Hawaiians | 0.0 /100 | #298 | Tragic 82.9% |
| Fijians | 0.0 /100 | #299 | Tragic 82.9% |
| Spanish American Indians | 0.0 /100 | #300 | Tragic 82.9% |
| Vietnamese | 0.0 /100 | #301 | Tragic 82.8% |
| Immigrants | Belize | 0.0 /100 | #302 | Tragic 82.8% |
| Immigrants | Grenada | 0.0 /100 | #303 | Tragic 82.8% |
| Immigrants | St. Vincent and the Grenadines | 0.0 /100 | #304 | Tragic 82.7% |
| Blacks/African Americans | 0.0 /100 | #305 | Tragic 82.6% |
| Blackfeet | 0.0 /100 | #306 | Tragic 82.6% |
| Cajuns | 0.0 /100 | #307 | Tragic 82.5% |
| Central American Indians | 0.0 /100 | #308 | Tragic 82.4% |
| Immigrants | Central America | 0.0 /100 | #309 | Tragic 82.4% |
Demographics Similar to Italians by In Labor Force | Age 25-29
In terms of in labor force | age 25-29, the demographic groups most similar to Italians are Turkish (85.6%, a difference of 0.0%), Swedish (85.6%, a difference of 0.010%), Czech (85.6%, a difference of 0.030%), Yugoslavian (85.6%, a difference of 0.040%), and Immigrants from Latvia (85.6%, a difference of 0.040%).
| Demographics | Rating | Rank | In Labor Force | Age 25-29 |
| Immigrants | Greece | 99.9 /100 | #41 | Exceptional 85.7% |
| Immigrants | Eritrea | 99.9 /100 | #42 | Exceptional 85.7% |
| Immigrants | India | 99.9 /100 | #43 | Exceptional 85.7% |
| Macedonians | 99.9 /100 | #44 | Exceptional 85.7% |
| Immigrants | Sierra Leone | 99.9 /100 | #45 | Exceptional 85.7% |
| Czechs | 99.8 /100 | #46 | Exceptional 85.6% |
| Turks | 99.8 /100 | #47 | Exceptional 85.6% |
| Italians | 99.8 /100 | #48 | Exceptional 85.6% |
| Swedes | 99.8 /100 | #49 | Exceptional 85.6% |
| Yugoslavians | 99.8 /100 | #50 | Exceptional 85.6% |
| Immigrants | Latvia | 99.8 /100 | #51 | Exceptional 85.6% |
| Immigrants | Poland | 99.7 /100 | #52 | Exceptional 85.6% |
| Belgians | 99.7 /100 | #53 | Exceptional 85.5% |
| Albanians | 99.7 /100 | #54 | Exceptional 85.5% |
| Immigrants | Brazil | 99.7 /100 | #55 | Exceptional 85.5% |