American vs Dutch West Indian In Labor Force | Age 30-34
COMPARE
American
Dutch West Indian
In Labor Force | Age 30-34
In Labor Force | Age 30-34 Comparison
Americans
Dutch West Indians
82.7%
IN LABOR FORCE | AGE 30-34
0.0/ 100
METRIC RATING
294th/ 347
METRIC RANK
81.0%
IN LABOR FORCE | AGE 30-34
0.0/ 100
METRIC RATING
325th/ 347
METRIC RANK
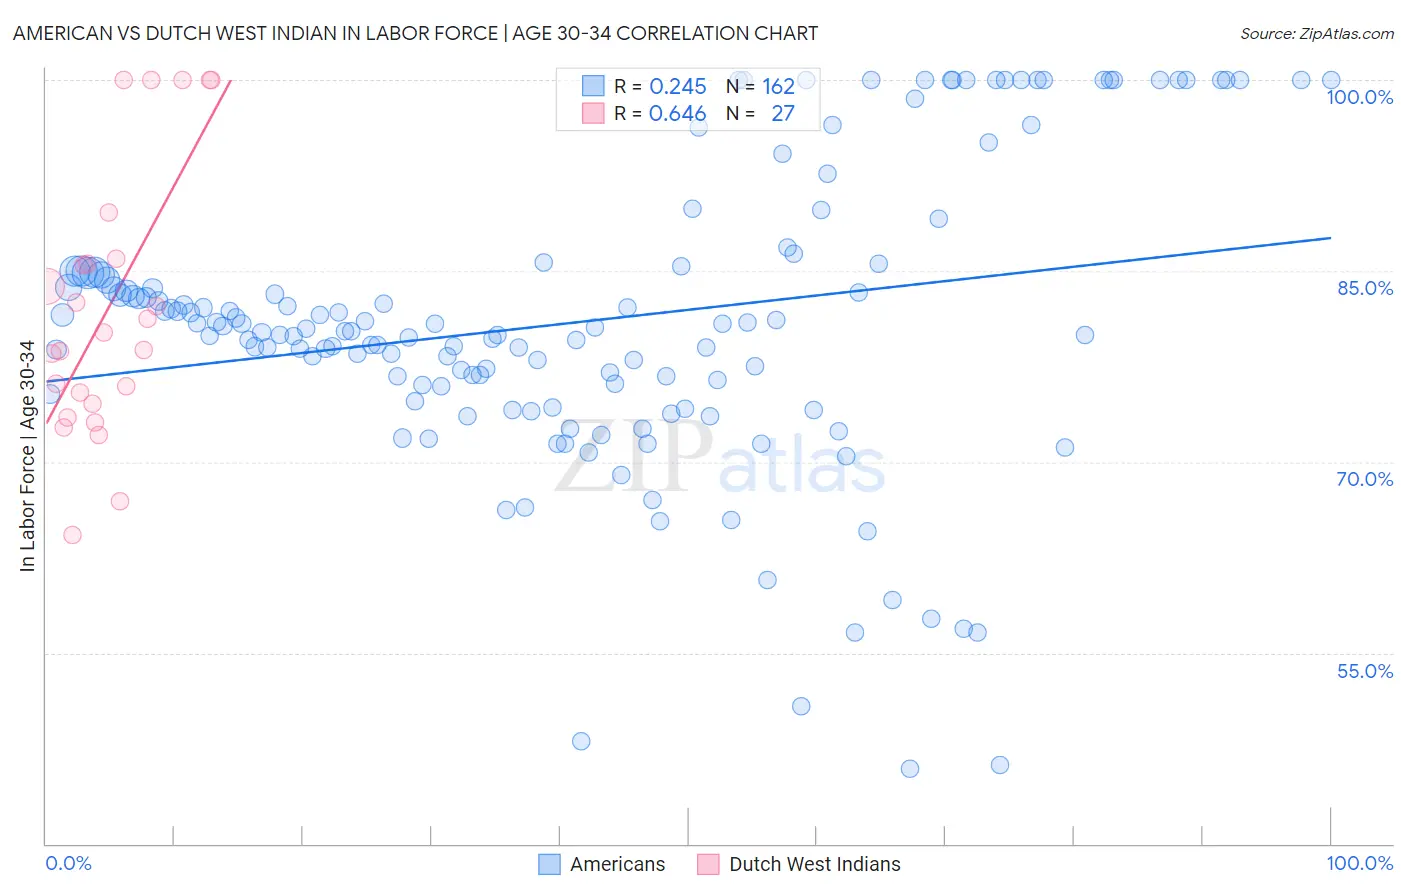
American vs Dutch West Indian In Labor Force | Age 30-34 Correlation Chart
The statistical analysis conducted on geographies consisting of 580,133,511 people shows a weak positive correlation between the proportion of Americans and labor force participation rate among population between the ages 30 and 34 in the United States with a correlation coefficient (R) of 0.245 and weighted average of 82.7%. Similarly, the statistical analysis conducted on geographies consisting of 85,757,980 people shows a significant positive correlation between the proportion of Dutch West Indians and labor force participation rate among population between the ages 30 and 34 in the United States with a correlation coefficient (R) of 0.646 and weighted average of 81.0%, a difference of 2.1%.
In Labor Force | Age 30-34 Correlation Summary
| Measurement | American | Dutch West Indian |
| Minimum | 45.9% | 64.3% |
| Maximum | 100.0% | 100.0% |
| Range | 54.1% | 35.7% |
| Mean | 81.0% | 82.1% |
| Median | 80.4% | 80.2% |
| Interquartile 25% (IQ1) | 75.9% | 74.5% |
| Interquartile 75% (IQ3) | 85.0% | 86.0% |
| Interquartile Range (IQR) | 9.0% | 11.4% |
| Standard Deviation (Sample) | 11.6% | 10.4% |
| Standard Deviation (Population) | 11.6% | 10.2% |
Similar Demographics by In Labor Force | Age 30-34
Demographics Similar to Americans by In Labor Force | Age 30-34
In terms of in labor force | age 30-34, the demographic groups most similar to Americans are Nepalese (82.7%, a difference of 0.020%), Black/African American (82.8%, a difference of 0.090%), Potawatomi (82.8%, a difference of 0.11%), Pennsylvania German (82.6%, a difference of 0.12%), and Blackfeet (82.8%, a difference of 0.13%).
| Demographics | Rating | Rank | In Labor Force | Age 30-34 |
| Native Hawaiians | 0.0 /100 | #287 | Tragic 83.0% |
| Central American Indians | 0.0 /100 | #288 | Tragic 83.0% |
| Hawaiians | 0.0 /100 | #289 | Tragic 83.0% |
| Blackfeet | 0.0 /100 | #290 | Tragic 82.8% |
| Potawatomi | 0.0 /100 | #291 | Tragic 82.8% |
| Blacks/African Americans | 0.0 /100 | #292 | Tragic 82.8% |
| Nepalese | 0.0 /100 | #293 | Tragic 82.7% |
| Americans | 0.0 /100 | #294 | Tragic 82.7% |
| Pennsylvania Germans | 0.0 /100 | #295 | Tragic 82.6% |
| Chippewa | 0.0 /100 | #296 | Tragic 82.6% |
| Comanche | 0.0 /100 | #297 | Tragic 82.6% |
| Aleuts | 0.0 /100 | #298 | Tragic 82.6% |
| Immigrants | Central America | 0.0 /100 | #299 | Tragic 82.5% |
| Hmong | 0.0 /100 | #300 | Tragic 82.4% |
| Hispanics or Latinos | 0.0 /100 | #301 | Tragic 82.4% |
Demographics Similar to Dutch West Indians by In Labor Force | Age 30-34
In terms of in labor force | age 30-34, the demographic groups most similar to Dutch West Indians are Cheyenne (81.1%, a difference of 0.15%), Paiute (81.2%, a difference of 0.19%), Seminole (80.8%, a difference of 0.22%), Puerto Rican (81.2%, a difference of 0.23%), and Alaska Native (81.3%, a difference of 0.39%).
| Demographics | Rating | Rank | In Labor Force | Age 30-34 |
| Choctaw | 0.0 /100 | #318 | Tragic 81.4% |
| Shoshone | 0.0 /100 | #319 | Tragic 81.4% |
| Yaqui | 0.0 /100 | #320 | Tragic 81.4% |
| Alaska Natives | 0.0 /100 | #321 | Tragic 81.3% |
| Puerto Ricans | 0.0 /100 | #322 | Tragic 81.2% |
| Paiute | 0.0 /100 | #323 | Tragic 81.2% |
| Cheyenne | 0.0 /100 | #324 | Tragic 81.1% |
| Dutch West Indians | 0.0 /100 | #325 | Tragic 81.0% |
| Seminole | 0.0 /100 | #326 | Tragic 80.8% |
| Colville | 0.0 /100 | #327 | Tragic 80.7% |
| Sioux | 0.0 /100 | #328 | Tragic 80.4% |
| Creek | 0.0 /100 | #329 | Tragic 80.4% |
| Pueblo | 0.0 /100 | #330 | Tragic 80.0% |
| Houma | 0.0 /100 | #331 | Tragic 79.9% |
| Kiowa | 0.0 /100 | #332 | Tragic 79.8% |