Immigrants from Belgium vs Immigrants from Armenia In Labor Force | Age 30-34
COMPARE
Immigrants from Belgium
Immigrants from Armenia
In Labor Force | Age 30-34
In Labor Force | Age 30-34 Comparison
Immigrants from Belgium
Immigrants from Armenia
85.3%
IN LABOR FORCE | AGE 30-34
98.2/ 100
METRIC RATING
88th/ 347
METRIC RANK
84.8%
IN LABOR FORCE | AGE 30-34
64.7/ 100
METRIC RATING
158th/ 347
METRIC RANK
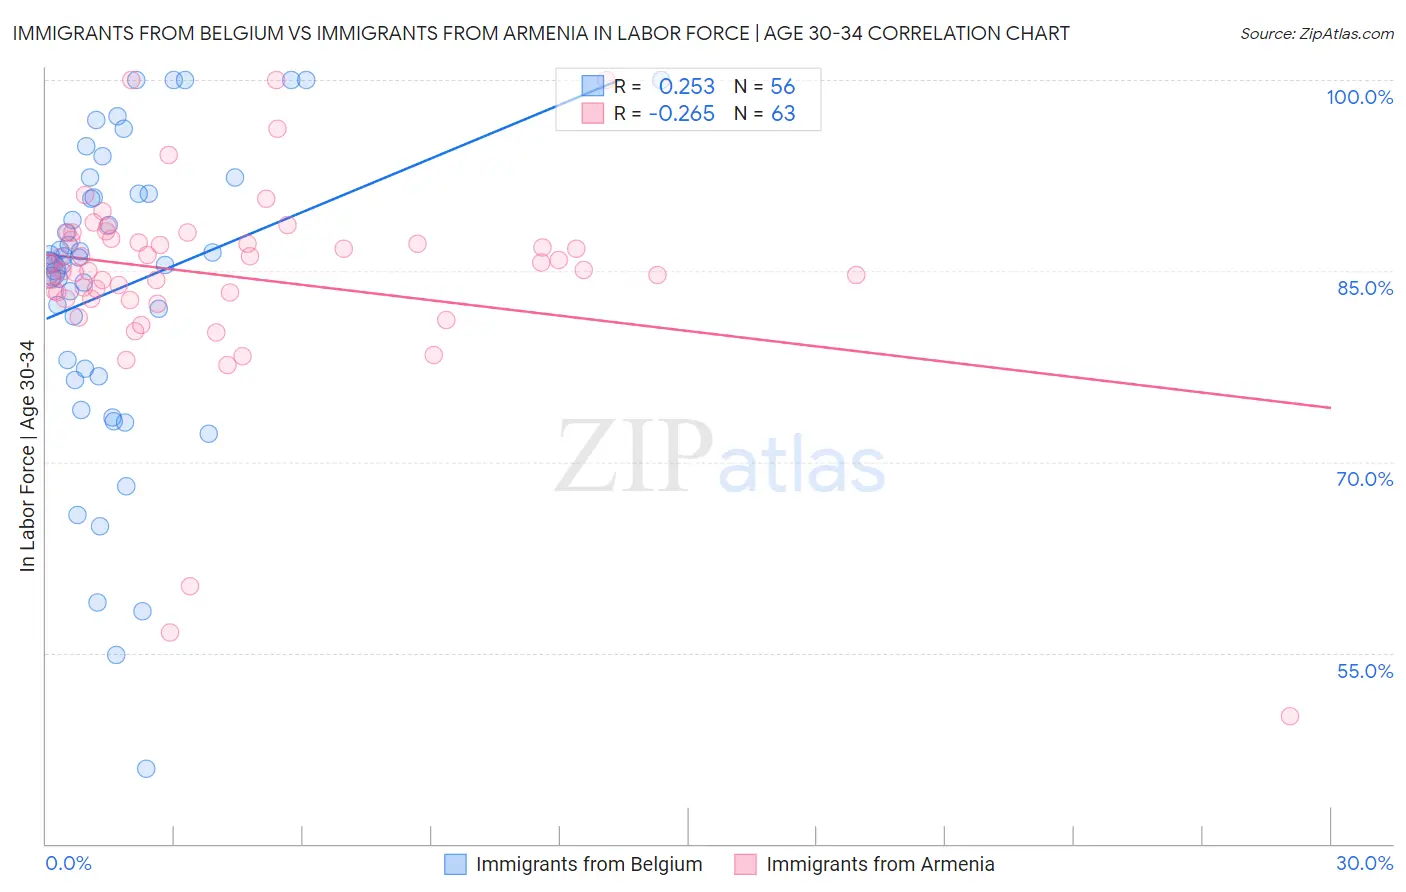
Immigrants from Belgium vs Immigrants from Armenia In Labor Force | Age 30-34 Correlation Chart
The statistical analysis conducted on geographies consisting of 146,692,103 people shows a weak positive correlation between the proportion of Immigrants from Belgium and labor force participation rate among population between the ages 30 and 34 in the United States with a correlation coefficient (R) of 0.253 and weighted average of 85.3%. Similarly, the statistical analysis conducted on geographies consisting of 97,710,300 people shows a weak negative correlation between the proportion of Immigrants from Armenia and labor force participation rate among population between the ages 30 and 34 in the United States with a correlation coefficient (R) of -0.265 and weighted average of 84.8%, a difference of 0.59%.
In Labor Force | Age 30-34 Correlation Summary
| Measurement | Immigrants from Belgium | Immigrants from Armenia |
| Minimum | 45.9% | 50.0% |
| Maximum | 100.0% | 100.0% |
| Range | 54.1% | 50.0% |
| Mean | 83.6% | 84.6% |
| Median | 85.6% | 85.2% |
| Interquartile 25% (IQ1) | 77.0% | 82.9% |
| Interquartile 75% (IQ3) | 91.1% | 87.5% |
| Interquartile Range (IQR) | 14.1% | 4.6% |
| Standard Deviation (Sample) | 12.1% | 8.1% |
| Standard Deviation (Population) | 12.0% | 8.0% |
Similar Demographics by In Labor Force | Age 30-34
Demographics Similar to Immigrants from Belgium by In Labor Force | Age 30-34
In terms of in labor force | age 30-34, the demographic groups most similar to Immigrants from Belgium are Immigrants from Taiwan (85.3%, a difference of 0.010%), Immigrants from Northern Europe (85.3%, a difference of 0.010%), Immigrants from Kazakhstan (85.3%, a difference of 0.010%), Burmese (85.3%, a difference of 0.020%), and Mongolian (85.3%, a difference of 0.030%).
| Demographics | Rating | Rank | In Labor Force | Age 30-34 |
| Slovaks | 98.7 /100 | #81 | Exceptional 85.3% |
| Immigrants | Africa | 98.6 /100 | #82 | Exceptional 85.3% |
| Immigrants | Europe | 98.6 /100 | #83 | Exceptional 85.3% |
| Greeks | 98.6 /100 | #84 | Exceptional 85.3% |
| Mongolians | 98.5 /100 | #85 | Exceptional 85.3% |
| Immigrants | Taiwan | 98.3 /100 | #86 | Exceptional 85.3% |
| Immigrants | Northern Europe | 98.2 /100 | #87 | Exceptional 85.3% |
| Immigrants | Belgium | 98.2 /100 | #88 | Exceptional 85.3% |
| Immigrants | Kazakhstan | 98.1 /100 | #89 | Exceptional 85.3% |
| Burmese | 97.9 /100 | #90 | Exceptional 85.3% |
| Immigrants | Moldova | 97.9 /100 | #91 | Exceptional 85.3% |
| German Russians | 97.7 /100 | #92 | Exceptional 85.2% |
| Immigrants | Norway | 97.6 /100 | #93 | Exceptional 85.2% |
| Swedes | 97.5 /100 | #94 | Exceptional 85.2% |
| Immigrants | India | 97.4 /100 | #95 | Exceptional 85.2% |
Demographics Similar to Immigrants from Armenia by In Labor Force | Age 30-34
In terms of in labor force | age 30-34, the demographic groups most similar to Immigrants from Armenia are Peruvian (84.8%, a difference of 0.010%), Czechoslovakian (84.8%, a difference of 0.010%), French Canadian (84.8%, a difference of 0.020%), Pakistani (84.7%, a difference of 0.030%), and Immigrants from Cambodia (84.7%, a difference of 0.030%).
| Demographics | Rating | Rank | In Labor Force | Age 30-34 |
| Immigrants | Senegal | 74.0 /100 | #151 | Good 84.8% |
| Romanians | 73.5 /100 | #152 | Good 84.8% |
| Syrians | 70.1 /100 | #153 | Good 84.8% |
| Northern Europeans | 70.0 /100 | #154 | Good 84.8% |
| Immigrants | Sudan | 69.5 /100 | #155 | Good 84.8% |
| French Canadians | 67.3 /100 | #156 | Good 84.8% |
| Peruvians | 65.9 /100 | #157 | Good 84.8% |
| Immigrants | Armenia | 64.7 /100 | #158 | Good 84.8% |
| Czechoslovakians | 63.0 /100 | #159 | Good 84.8% |
| Pakistanis | 60.8 /100 | #160 | Good 84.7% |
| Immigrants | Cambodia | 60.7 /100 | #161 | Good 84.7% |
| South Americans | 58.7 /100 | #162 | Average 84.7% |
| Immigrants | Uruguay | 57.4 /100 | #163 | Average 84.7% |
| Icelanders | 56.8 /100 | #164 | Average 84.7% |
| Immigrants | Western Europe | 56.7 /100 | #165 | Average 84.7% |