Immigrants from Barbados vs Immigrants from Eastern Africa In Labor Force | Age 20-64
COMPARE
Immigrants from Barbados
Immigrants from Eastern Africa
In Labor Force | Age 20-64
In Labor Force | Age 20-64 Comparison
Immigrants from Barbados
Immigrants from Eastern Africa
78.3%
IN LABOR FORCE | AGE 20-64
0.0/ 100
METRIC RATING
269th/ 347
METRIC RANK
81.3%
IN LABOR FORCE | AGE 20-64
100.0/ 100
METRIC RATING
11th/ 347
METRIC RANK
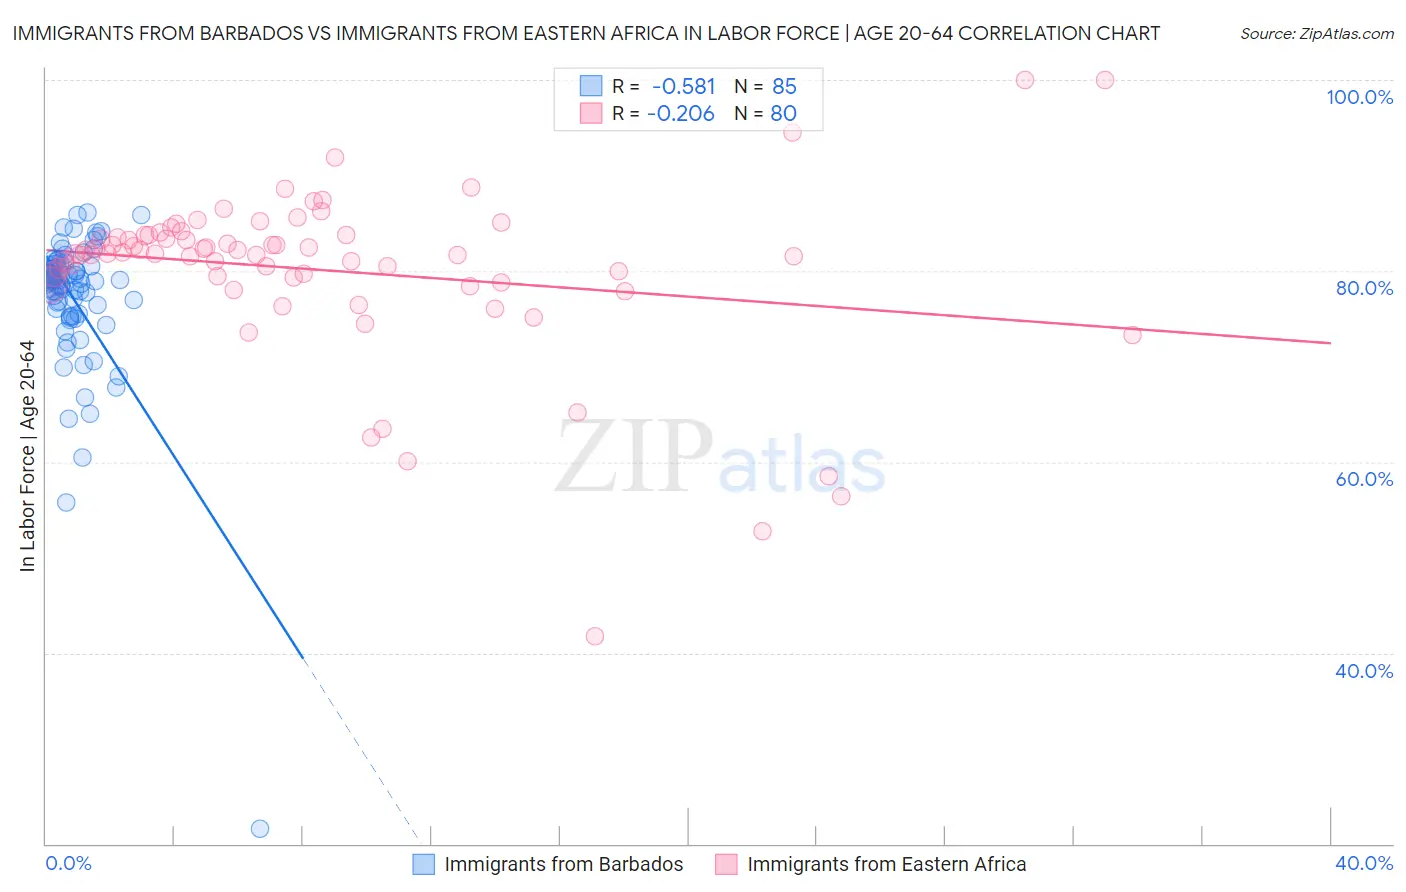
Immigrants from Barbados vs Immigrants from Eastern Africa In Labor Force | Age 20-64 Correlation Chart
The statistical analysis conducted on geographies consisting of 112,778,506 people shows a substantial negative correlation between the proportion of Immigrants from Barbados and labor force participation rate among population between the ages 20 and 64 in the United States with a correlation coefficient (R) of -0.581 and weighted average of 78.3%. Similarly, the statistical analysis conducted on geographies consisting of 355,171,667 people shows a weak negative correlation between the proportion of Immigrants from Eastern Africa and labor force participation rate among population between the ages 20 and 64 in the United States with a correlation coefficient (R) of -0.206 and weighted average of 81.3%, a difference of 3.8%.
In Labor Force | Age 20-64 Correlation Summary
| Measurement | Immigrants from Barbados | Immigrants from Eastern Africa |
| Minimum | 21.6% | 41.8% |
| Maximum | 86.1% | 100.0% |
| Range | 64.5% | 58.2% |
| Mean | 77.0% | 80.1% |
| Median | 78.9% | 81.8% |
| Interquartile 25% (IQ1) | 75.4% | 79.0% |
| Interquartile 75% (IQ3) | 80.5% | 83.7% |
| Interquartile Range (IQR) | 5.1% | 4.7% |
| Standard Deviation (Sample) | 8.1% | 9.1% |
| Standard Deviation (Population) | 8.1% | 9.0% |
Similar Demographics by In Labor Force | Age 20-64
Demographics Similar to Immigrants from Barbados by In Labor Force | Age 20-64
In terms of in labor force | age 20-64, the demographic groups most similar to Immigrants from Barbados are Scotch-Irish (78.3%, a difference of 0.020%), Immigrants from Latin America (78.3%, a difference of 0.040%), Marshallese (78.3%, a difference of 0.040%), West Indian (78.3%, a difference of 0.050%), and U.S. Virgin Islander (78.4%, a difference of 0.070%).
| Demographics | Rating | Rank | In Labor Force | Age 20-64 |
| Fijians | 0.1 /100 | #262 | Tragic 78.4% |
| Pennsylvania Germans | 0.1 /100 | #263 | Tragic 78.4% |
| Spaniards | 0.1 /100 | #264 | Tragic 78.4% |
| British West Indians | 0.1 /100 | #265 | Tragic 78.4% |
| Bahamians | 0.1 /100 | #266 | Tragic 78.4% |
| U.S. Virgin Islanders | 0.1 /100 | #267 | Tragic 78.4% |
| West Indians | 0.0 /100 | #268 | Tragic 78.3% |
| Immigrants | Barbados | 0.0 /100 | #269 | Tragic 78.3% |
| Scotch-Irish | 0.0 /100 | #270 | Tragic 78.3% |
| Immigrants | Latin America | 0.0 /100 | #271 | Tragic 78.3% |
| Marshallese | 0.0 /100 | #272 | Tragic 78.3% |
| French American Indians | 0.0 /100 | #273 | Tragic 78.2% |
| Aleuts | 0.0 /100 | #274 | Tragic 78.2% |
| Spanish | 0.0 /100 | #275 | Tragic 78.2% |
| Puget Sound Salish | 0.0 /100 | #276 | Tragic 78.2% |
Demographics Similar to Immigrants from Eastern Africa by In Labor Force | Age 20-64
In terms of in labor force | age 20-64, the demographic groups most similar to Immigrants from Eastern Africa are Immigrants from Eritrea (81.3%, a difference of 0.030%), Immigrants from India (81.3%, a difference of 0.060%), Immigrants from Sierra Leone (81.5%, a difference of 0.18%), Immigrants from Somalia (81.6%, a difference of 0.30%), and Sierra Leonean (81.5%, a difference of 0.30%).
| Demographics | Rating | Rank | In Labor Force | Age 20-64 |
| Luxembourgers | 100.0 /100 | #4 | Exceptional 81.9% |
| Bolivians | 100.0 /100 | #5 | Exceptional 81.7% |
| Somalis | 100.0 /100 | #6 | Exceptional 81.6% |
| Immigrants | Cameroon | 100.0 /100 | #7 | Exceptional 81.6% |
| Immigrants | Somalia | 100.0 /100 | #8 | Exceptional 81.6% |
| Sierra Leoneans | 100.0 /100 | #9 | Exceptional 81.5% |
| Immigrants | Sierra Leone | 100.0 /100 | #10 | Exceptional 81.5% |
| Immigrants | Eastern Africa | 100.0 /100 | #11 | Exceptional 81.3% |
| Immigrants | Eritrea | 100.0 /100 | #12 | Exceptional 81.3% |
| Immigrants | India | 100.0 /100 | #13 | Exceptional 81.3% |
| Cambodians | 100.0 /100 | #14 | Exceptional 81.1% |
| Bulgarians | 100.0 /100 | #15 | Exceptional 81.1% |
| Immigrants | Nepal | 100.0 /100 | #16 | Exceptional 81.1% |
| Norwegians | 100.0 /100 | #17 | Exceptional 81.0% |
| Immigrants | Bulgaria | 100.0 /100 | #18 | Exceptional 81.0% |