Immigrants from Barbados vs Mongolian In Labor Force | Age 20-64
COMPARE
Immigrants from Barbados
Mongolian
In Labor Force | Age 20-64
In Labor Force | Age 20-64 Comparison
Immigrants from Barbados
Mongolians
78.3%
IN LABOR FORCE | AGE 20-64
0.0/ 100
METRIC RATING
269th/ 347
METRIC RANK
79.9%
IN LABOR FORCE | AGE 20-64
92.0/ 100
METRIC RATING
122nd/ 347
METRIC RANK
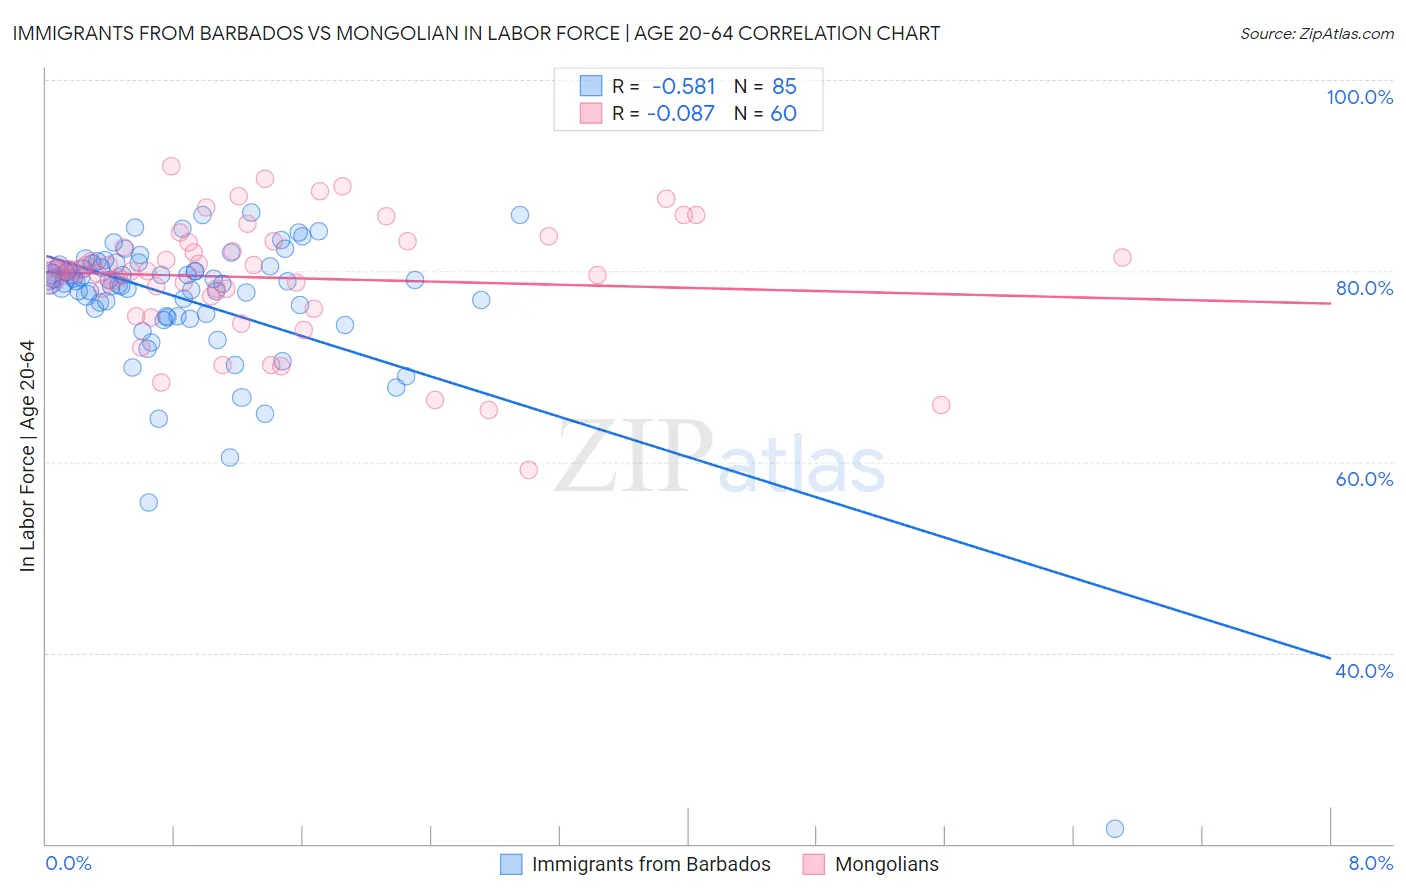
Immigrants from Barbados vs Mongolian In Labor Force | Age 20-64 Correlation Chart
The statistical analysis conducted on geographies consisting of 112,778,506 people shows a substantial negative correlation between the proportion of Immigrants from Barbados and labor force participation rate among population between the ages 20 and 64 in the United States with a correlation coefficient (R) of -0.581 and weighted average of 78.3%. Similarly, the statistical analysis conducted on geographies consisting of 140,359,372 people shows a slight negative correlation between the proportion of Mongolians and labor force participation rate among population between the ages 20 and 64 in the United States with a correlation coefficient (R) of -0.087 and weighted average of 79.9%, a difference of 2.1%.
In Labor Force | Age 20-64 Correlation Summary
| Measurement | Immigrants from Barbados | Mongolian |
| Minimum | 21.6% | 59.1% |
| Maximum | 86.1% | 91.0% |
| Range | 64.5% | 31.9% |
| Mean | 77.0% | 79.3% |
| Median | 78.9% | 80.0% |
| Interquartile 25% (IQ1) | 75.4% | 77.7% |
| Interquartile 75% (IQ3) | 80.5% | 83.0% |
| Interquartile Range (IQR) | 5.1% | 5.3% |
| Standard Deviation (Sample) | 8.1% | 6.4% |
| Standard Deviation (Population) | 8.1% | 6.3% |
Similar Demographics by In Labor Force | Age 20-64
Demographics Similar to Immigrants from Barbados by In Labor Force | Age 20-64
In terms of in labor force | age 20-64, the demographic groups most similar to Immigrants from Barbados are Scotch-Irish (78.3%, a difference of 0.020%), Immigrants from Latin America (78.3%, a difference of 0.040%), Marshallese (78.3%, a difference of 0.040%), West Indian (78.3%, a difference of 0.050%), and U.S. Virgin Islander (78.4%, a difference of 0.070%).
| Demographics | Rating | Rank | In Labor Force | Age 20-64 |
| Fijians | 0.1 /100 | #262 | Tragic 78.4% |
| Pennsylvania Germans | 0.1 /100 | #263 | Tragic 78.4% |
| Spaniards | 0.1 /100 | #264 | Tragic 78.4% |
| British West Indians | 0.1 /100 | #265 | Tragic 78.4% |
| Bahamians | 0.1 /100 | #266 | Tragic 78.4% |
| U.S. Virgin Islanders | 0.1 /100 | #267 | Tragic 78.4% |
| West Indians | 0.0 /100 | #268 | Tragic 78.3% |
| Immigrants | Barbados | 0.0 /100 | #269 | Tragic 78.3% |
| Scotch-Irish | 0.0 /100 | #270 | Tragic 78.3% |
| Immigrants | Latin America | 0.0 /100 | #271 | Tragic 78.3% |
| Marshallese | 0.0 /100 | #272 | Tragic 78.3% |
| French American Indians | 0.0 /100 | #273 | Tragic 78.2% |
| Aleuts | 0.0 /100 | #274 | Tragic 78.2% |
| Spanish | 0.0 /100 | #275 | Tragic 78.2% |
| Puget Sound Salish | 0.0 /100 | #276 | Tragic 78.2% |
Demographics Similar to Mongolians by In Labor Force | Age 20-64
In terms of in labor force | age 20-64, the demographic groups most similar to Mongolians are Immigrants from Taiwan (80.0%, a difference of 0.010%), Maltese (80.0%, a difference of 0.010%), Immigrants from Kuwait (80.0%, a difference of 0.010%), Immigrants from Russia (79.9%, a difference of 0.010%), and Immigrants from Europe (79.9%, a difference of 0.010%).
| Demographics | Rating | Rank | In Labor Force | Age 20-64 |
| Bermudans | 93.3 /100 | #115 | Exceptional 80.0% |
| Immigrants | Western Africa | 93.1 /100 | #116 | Exceptional 80.0% |
| Immigrants | Vietnam | 92.7 /100 | #117 | Exceptional 80.0% |
| Cape Verdeans | 92.7 /100 | #118 | Exceptional 80.0% |
| Immigrants | Taiwan | 92.5 /100 | #119 | Exceptional 80.0% |
| Maltese | 92.4 /100 | #120 | Exceptional 80.0% |
| Immigrants | Kuwait | 92.2 /100 | #121 | Exceptional 80.0% |
| Mongolians | 92.0 /100 | #122 | Exceptional 79.9% |
| Immigrants | Russia | 91.8 /100 | #123 | Exceptional 79.9% |
| Immigrants | Europe | 91.6 /100 | #124 | Exceptional 79.9% |
| Danes | 91.5 /100 | #125 | Exceptional 79.9% |
| Immigrants | France | 90.7 /100 | #126 | Exceptional 79.9% |
| Immigrants | Czechoslovakia | 89.7 /100 | #127 | Excellent 79.9% |
| Immigrants | Eastern Asia | 89.4 /100 | #128 | Excellent 79.9% |
| Italians | 88.9 /100 | #129 | Excellent 79.9% |