Immigrants from Nepal vs Immigrants from Eastern Africa In Labor Force | Age 45-54
COMPARE
Immigrants from Nepal
Immigrants from Eastern Africa
In Labor Force | Age 45-54
In Labor Force | Age 45-54 Comparison
Immigrants from Nepal
Immigrants from Eastern Africa
84.0%
IN LABOR FORCE | AGE 45-54
99.9/ 100
METRIC RATING
16th/ 347
METRIC RANK
83.9%
IN LABOR FORCE | AGE 45-54
99.8/ 100
METRIC RATING
20th/ 347
METRIC RANK
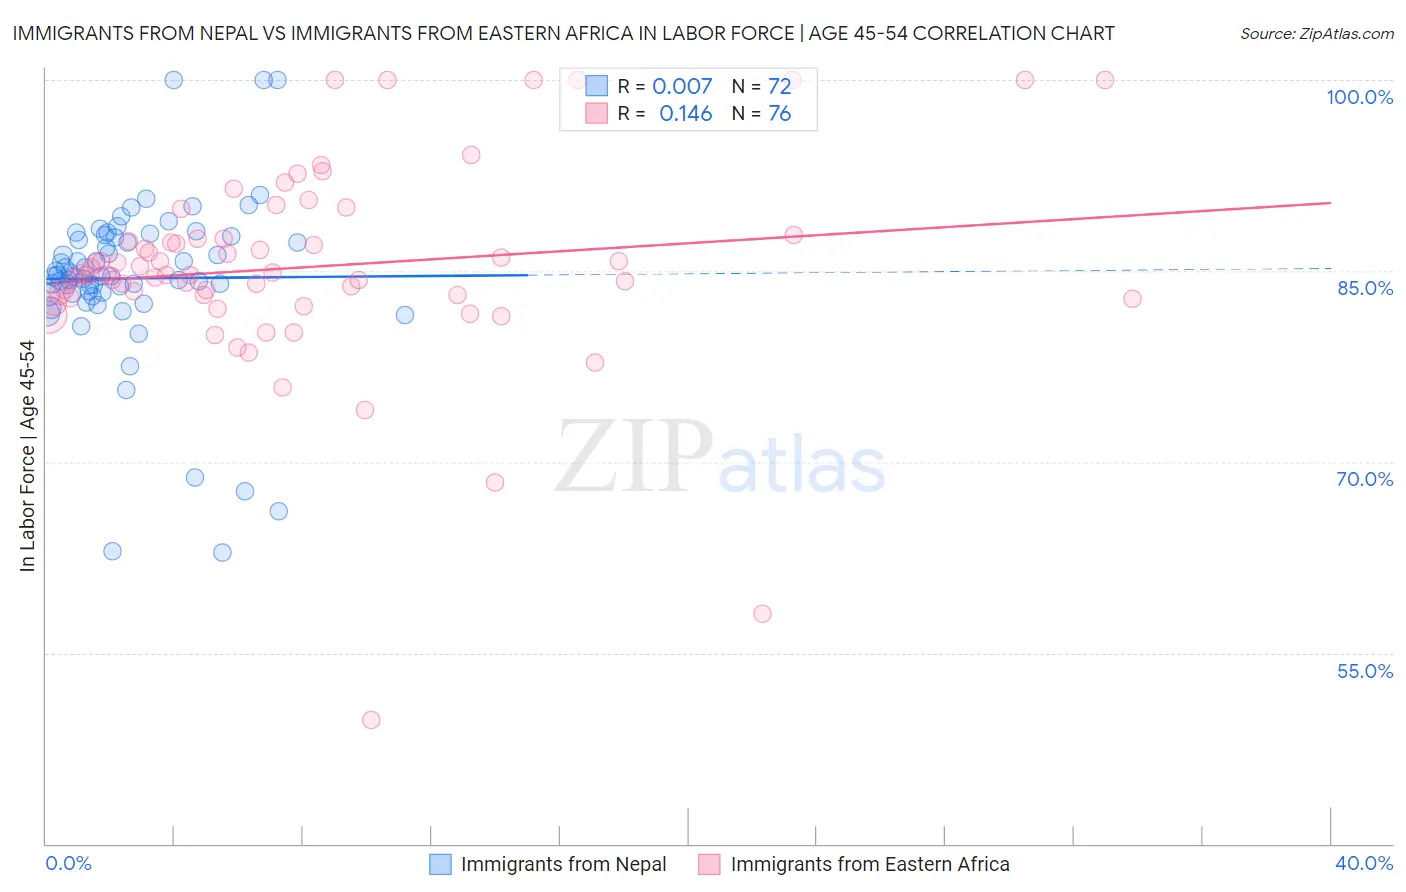
Immigrants from Nepal vs Immigrants from Eastern Africa In Labor Force | Age 45-54 Correlation Chart
The statistical analysis conducted on geographies consisting of 186,685,314 people shows no correlation between the proportion of Immigrants from Nepal and labor force participation rate among population between the ages 45 and 54 in the United States with a correlation coefficient (R) of 0.007 and weighted average of 84.0%. Similarly, the statistical analysis conducted on geographies consisting of 354,881,316 people shows a poor positive correlation between the proportion of Immigrants from Eastern Africa and labor force participation rate among population between the ages 45 and 54 in the United States with a correlation coefficient (R) of 0.146 and weighted average of 83.9%, a difference of 0.15%.
In Labor Force | Age 45-54 Correlation Summary
| Measurement | Immigrants from Nepal | Immigrants from Eastern Africa |
| Minimum | 62.9% | 49.7% |
| Maximum | 100.0% | 100.0% |
| Range | 37.1% | 50.3% |
| Mean | 84.4% | 85.3% |
| Median | 84.6% | 84.7% |
| Interquartile 25% (IQ1) | 83.2% | 83.0% |
| Interquartile 75% (IQ3) | 87.6% | 87.5% |
| Interquartile Range (IQR) | 4.5% | 4.5% |
| Standard Deviation (Sample) | 6.6% | 8.0% |
| Standard Deviation (Population) | 6.6% | 8.0% |
Demographics Similar to Immigrants from Nepal and Immigrants from Eastern Africa by In Labor Force | Age 45-54
In terms of in labor force | age 45-54, the demographic groups most similar to Immigrants from Nepal are Cypriot (84.1%, a difference of 0.020%), Zimbabwean (84.0%, a difference of 0.020%), Immigrants from South Central Asia (84.0%, a difference of 0.030%), Cambodian (84.1%, a difference of 0.080%), and Chinese (84.1%, a difference of 0.11%). Similarly, the demographic groups most similar to Immigrants from Eastern Africa are Immigrants from Sri Lanka (83.9%, a difference of 0.0%), Immigrants from Ireland (83.9%, a difference of 0.0%), Czech (83.9%, a difference of 0.010%), Tlingit-Haida (83.9%, a difference of 0.010%), and Slovene (83.9%, a difference of 0.010%).
| Demographics | Rating | Rank | In Labor Force | Age 45-54 |
| Sierra Leoneans | 100.0 /100 | #8 | Exceptional 84.5% |
| Immigrants | Sierra Leone | 100.0 /100 | #9 | Exceptional 84.4% |
| Norwegians | 100.0 /100 | #10 | Exceptional 84.4% |
| Thais | 100.0 /100 | #11 | Exceptional 84.3% |
| Bulgarians | 100.0 /100 | #12 | Exceptional 84.2% |
| Chinese | 99.9 /100 | #13 | Exceptional 84.1% |
| Cambodians | 99.9 /100 | #14 | Exceptional 84.1% |
| Cypriots | 99.9 /100 | #15 | Exceptional 84.1% |
| Immigrants | Nepal | 99.9 /100 | #16 | Exceptional 84.0% |
| Zimbabweans | 99.9 /100 | #17 | Exceptional 84.0% |
| Immigrants | South Central Asia | 99.9 /100 | #18 | Exceptional 84.0% |
| Czechs | 99.8 /100 | #19 | Exceptional 83.9% |
| Immigrants | Eastern Africa | 99.8 /100 | #20 | Exceptional 83.9% |
| Immigrants | Sri Lanka | 99.8 /100 | #21 | Exceptional 83.9% |
| Immigrants | Ireland | 99.8 /100 | #22 | Exceptional 83.9% |
| Tlingit-Haida | 99.8 /100 | #23 | Exceptional 83.9% |
| Slovenes | 99.8 /100 | #24 | Exceptional 83.9% |
| Immigrants | North Macedonia | 99.8 /100 | #25 | Exceptional 83.9% |
| Immigrants | Serbia | 99.8 /100 | #26 | Exceptional 83.9% |
| Immigrants | Brazil | 99.8 /100 | #27 | Exceptional 83.9% |
| Immigrants | Lithuania | 99.8 /100 | #28 | Exceptional 83.9% |